Measuring Best & Worst UK 100 performers
What does our data set tell us? Which of the derived metrics is most useful in determining which stock typically performs well during the summer months, and which does poorly?
Every company has its ups and downs and judging a stock’s summertime performance by the worst and best year, or even just the last 3-5 years, can be dangerous. Those results could easily have been influenced by macroeconomic conditions (a Referendum perhaps?) as much as by the summer period itself.
The metrics most useful to investors include Average Share Price Performance as well as the Number of Years the share price delivered positive returns. In some cases, however, investors must beware of and consider that some companies have a limited trading history, having only been listed on the London Stock Exchange for a few years. A great summer performance hit rate can be flattered by just a few years’ worth of data.
As always, ranking companies by a single metric can obscure trends and a research-oriented investor needs to examine several factors to make a more balanced investing decision.
When all is said and done, how does the “Sell in May” theory correlate with actual pricing data? The table below showcases yearly performance (full dataset: 1994-2017) for the 20 UK 100 companies which have seen their share price increase the most years since 1994, during our May-to-September target period.
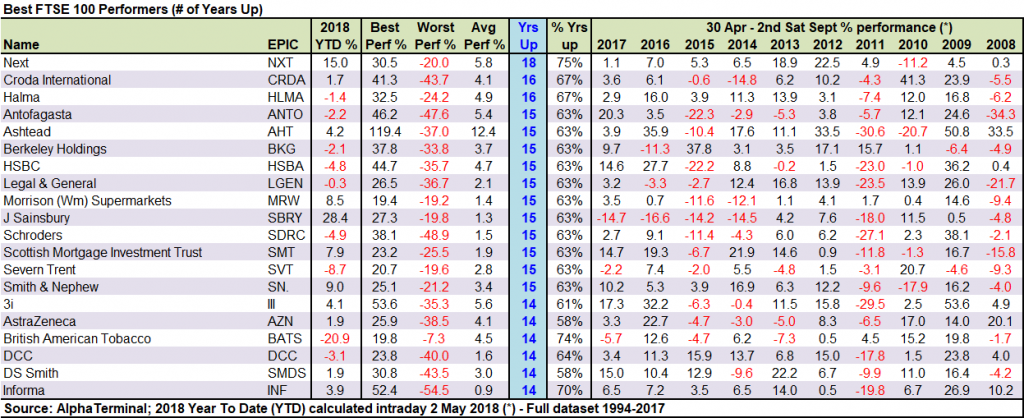
What is clear from the table is that the selection of the most reliable stocks (those whose shares repeatedly rally during the summer months) is not limited to any specific industry or sector. Retailer Next (18 positive summer performances out of 24), sits alongside Copper miner Antofagasta, banking giant HSBC and water utility Severn Trent (all 15). So much for the theory that utilities underperform in the summer, eh?
However, 24 years is a long time; some may only have done well many years ago, flattering their history. Apart from the absolute number of positive summer share price rises, we can also compare UK 100 constituents based on Average Performance during summer period.
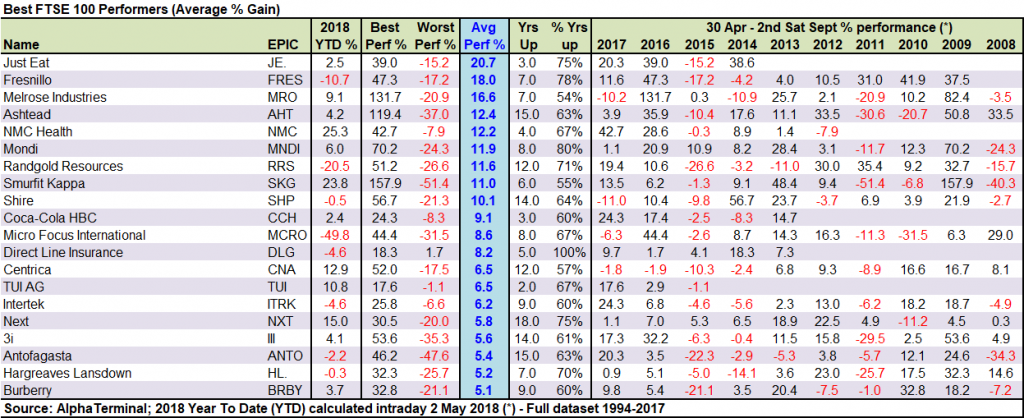
What is striking in the above table is how different it is from the prior one. While the repeat performers who have rallied each summer in the previous 24 years are, by necessity, the old stalwarts of the LSE, the biggest performers, those whose share price has risen the most on average, feature many new and young faces.
The best performers on this list are companies such as online delivery service Just Eat (20.7% average stock price rise during our target period) and UAE-based healthcare chain NMC Health (12.2%), both of which have only been on the LSE for 4 and 6 years, respectively.
Other companies of note include Direct Line Insurance (average +8.2%), which has rallied in each of the 5 summer periods since its IPO, as well as Melrose Industries, which has rallied an astonishing 131.7% in summer 2016 (M&A), outperforming the likes of equipment rental outfit Ashtead (+35.9%), bottling company Coca-Cola HBC (+17,4%) and 3i (32.2%) in the same period.
The table also demonstrates the limitations of measuring average performance across a long period. Utility company Centrica shows an average 6.5% share price rise (up in 12 of 24 years), but in recent years it has underperformed during our target period, posting negative share price growth in 2014-17. To find Centrica’s best summer period, you need to go back all the way to summer 1997, when its share price (demerger from British Gas at the time) climbed 52% after is IPO.
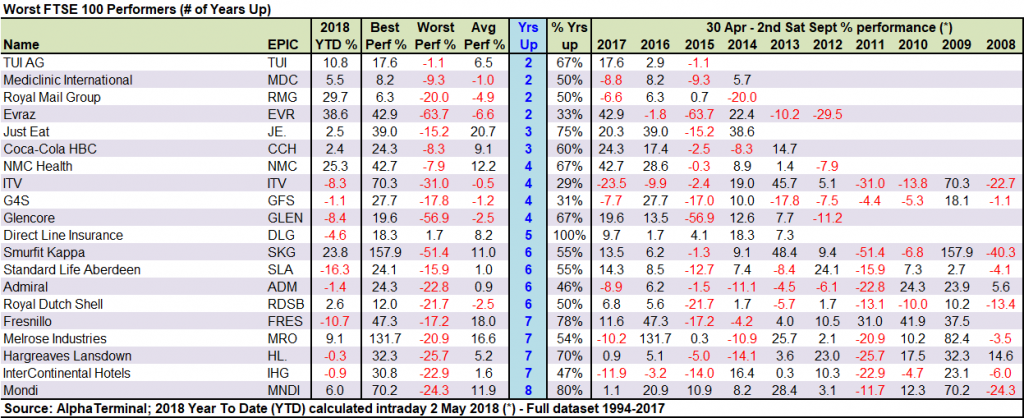
On the flip side, some of the worst performing shares exhibit a high amount of volatility. Russian steel producer Evraz has seen its share price see-saw during the summer months between -29.5% (2012), +22.4% (2014), -63.7% (2016) and 42.9% (2017), resulting in an average summer performance of -6.6%.
With a 2018 year-to-date performance of +42.9%, Evraz’s share price movement has a greater correlation with economic factors such as the situation on the commodity markets and geopolitical concerns (i.e. steel tariffs, international trade sanctions), rather than seasonality on the London Stock Exchange.
For the full breakdown of these figures, or to discuss options with one of our traders, please contact [email protected] and we will call you back with the information requested.
Top Dogs
Besides looking at the average performance of UK 100 stocks, investors can also examine specific companies that stand out of the crowd. The purpose of this more detailed look is to put the select companies under a microscope and understand what separates stocks that typically overperform during the summer months from those that typically underperform.
These are not simply our “Summer Top Stock Picks”, rather a sample of three stocks from both ends of the summer performance spectrum, giving a more nuanced appreciation of where they currently trade, what sets them apart from their peers and what potential they may have over our target period.
Continue reading to find out more about three select companies that have typically overperformed during summer months, as well as three select companies which have typically underperformed.