The information on this page is not a personal recommendation and does not take into account your personal circumstances or appetite for risk.
Moving Average (MA) Crossovers can provide clear and actionable buy and sell signals.
Shorter and longer term moving averages can be combined to create a useful technical indicator. To simplify, when a short term MA (or current price) moves above the longer term, it creates a buy signal known as a Golden Cross. When the long term MA moves above the shorter term (or current price), it creates a sell signal, known as a Dead Cross.
Explanation
Simple moving averages (MA) are a rolling arithmetic mean of a share price over a given period. They smooth price data, highlighting a share price’s underlying trend. Based on historical data, they are, of course, lagging indicators, however, when used in combination with other MAs, prices and share price patterns, can be extremely helpful in identifying shifts in trend. MA crossovers (MAs with MAs, MAs with price, MAs with price patterns) signal key shifts in momentum and support/resistance when a shorter term MA moves up/down through a longer-term counterpart. Long-term crossovers are more significant than short-term crossovers. A Golden Cross represents a major shift from bearish to bullish, with the 50-day MA breaking above the 200-day MA. At this point the 200-day normally becomes major support. Its negative counterpart, the Dead Cross reinstates bear power with the 50-day MA falling back below the 200-day MA at which point the 200-day MA becomes major resistance. Prices can become trapped between the 50 and 200-day MAs, moving repeatedly between the extremes. When shares are range-bound, trading sideways in a confined area, with littleup/down direction, MAs lose their power (oscillators work better). MA crossovers work best when shares are trending.
Example
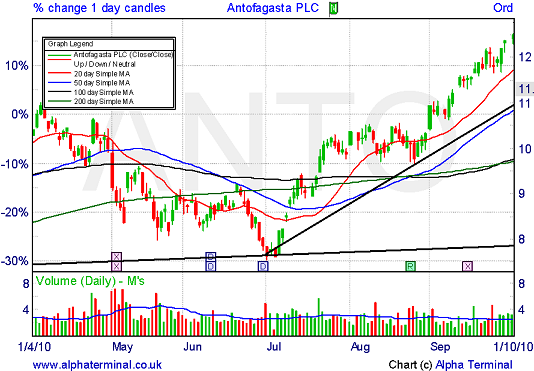
After bouncing off a support line in early July, ANTO’s price crossed up through its 20-Day (red), 50-day (Blue), 200-day (Green) and finally 100-day MA (Black). While these crosses were positive signals of a change in trend, the subsequent move by the 20-day MA up through its longer term counterparts offered stronger (albeit later) confirmation.
End August you see the Golden Cross (50-day break through the 200-day), followed even more recently by the shares moving up through the 100-day MA. In addition a new trendline can now be drawn from the July low through the beginning of September low, signaling potential support should the shares weaken from current levels.

Remember…
Individual technical indicators should never be relied upon in isolation for trading decisions, however strong a signal may be. Ultimately they are one of many indicators, which may, in the majority, be pointing the other way. Always use indicators such as moving averages in combination with other indicators (trendlines, price, price patterns, support/resistance) to assist in the final trading decision. Lastly, the current trend of a share should always be respected – pre-empting a change in trend more often than not proves costly.