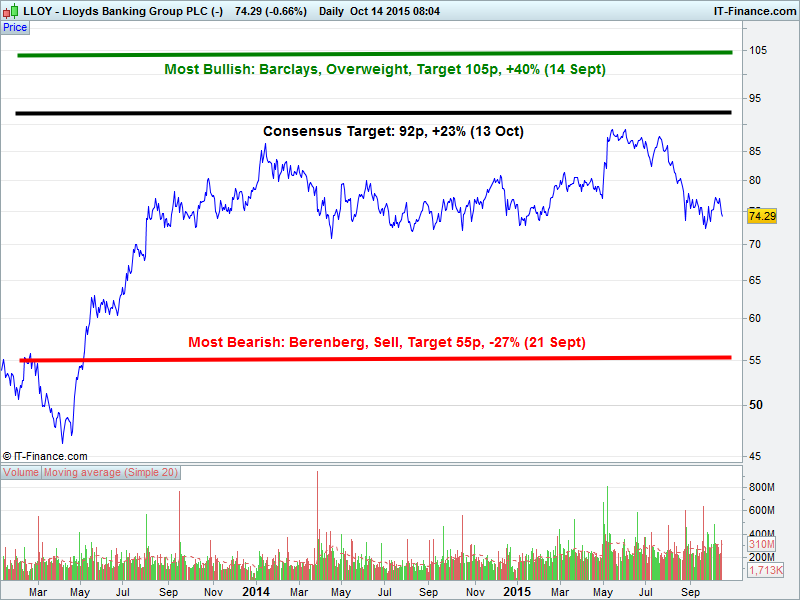
Lloyds Banking Group – 2.5 year price chart
This report is not a personal recommendation and does not take into account your personal circumstances or appetite for risk.
Will the shares rally towards highs of 89p or fall towards lows of 46p?
Broker Consensus: 54% Buy, 32% Hold, 14% Sell Next event: Q3 Results 28 Oct
NB: All pricing and consensus data from Bloomberg on 13 Oct; Consensus breakdown available on request
————————————————————————
For any questions on how to trade Lloyds shares via CFDs or shares,
including ways in which your risk can be managed,
call us to discuss on 0203 051 7461
———————————————————————-
Open a Demo account CLICK DEMO
Subscribe to a Free Research trial CLICK RESEARCH
Apply for a Live Account CLICK ACCOUNT
This research is produced by Accendo Markets Limited. Research produced and disseminated by Accendo Markets is classified as non-independent research, and is therefore a marketing communication. This investment research has not been prepared in accordance with legal requirements designed to promote its independence and it is not subject to the prohibition on dealing ahead of the dissemination of investment research. This research does not constitute a personal recommendation or offer to enter into a transaction or an investment, and is produced and distributed for information purposes only.
Accendo Markets considers opinions and information contained within the research to be valid when published, and gives no warranty as to the investments referred to in this material. The income from the investments referred to may go down as well as up, and investors may realise losses on investments. The past performance of a particular investment is not necessarily a guide to its future performance. Prepared by Michael van Dulken, Head of Research
Comments are closed.