27 November 2015
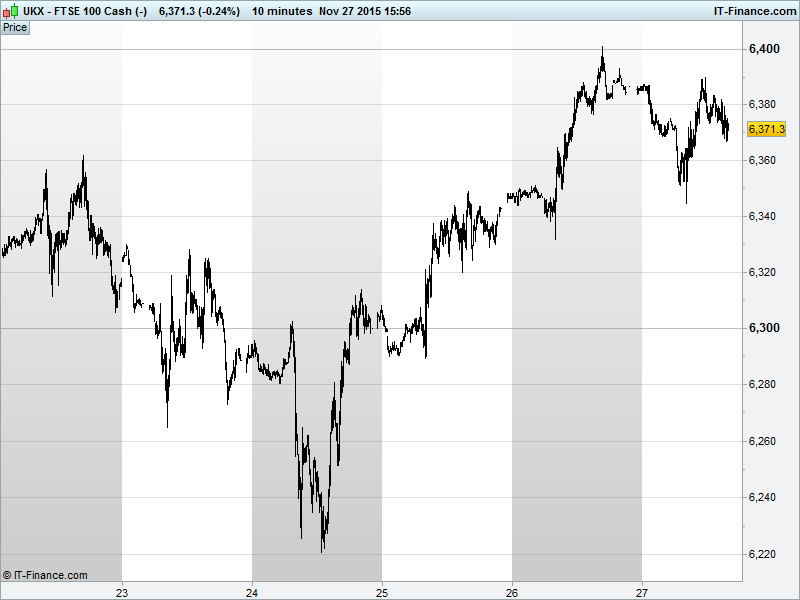
This week I had the same conversation with several clients. Asked whether the UK Index could get back to 6400, each time I answered that ‘yes it could’. Of course it could, it’s binary (it might, it might not), however, this was enough to satisfy the many clients who wanted to buy into the current rally, albeit late. However, their joy was short-lived when I added the big fat caveat that while a revisit of 6400 would indeed maintain the uptrend from 6000 November lows, and take the recovery rally to a meaty 6.7%, it didn’t represent anything like the genuine breakout I was looking for. When asked ‘what breakout?’ I discovered that none were looking at long enough time-frame charts (at least 6 months) to notice the strong trend-line of falling resistance since late May which was intersecting around 6385 and could put the kibosh on the current bullish trend. How interesting it was therefore to see that UK Index futures crept higher on Thursday night to hit 6400 only to fall quickly back to 6350.
This example highlights three things, all of which are key elements of technical analysis or using charts for trading/investing. Firstly, you need to be aware of both short- and long-term trends. The thin gap between two parked cars might suggest no traffic and that it’s safe to cross, but it doesn’t mean that cars aren’t speeding dangerously your way. Secondly, a breakout is only genuine when some headway has been made (a few percent or few days spent above) and, ideally, the breached trend-line has subsequently served as support for any pullback. Otherwise it’s merely an uncertain test/foray higher. Lastly, round numbers have a habit of being used as psychological levels, earmarked for buying at the bottom and cashing out at the top, with limit orders often left in the system to trigger trades automatically when the levels are hit.
After strong gains recently from round number 6000, the 6400 level was clearly used as a get-out point for traders to bank healthy 2-week gains, with the selling pressure sending us back below the tested trend-line. It could be that we rally on. It could be that we fall back. However, for now the trend-line remains resistance. It’s not about calling breakouts and rebounds 100% right at the top/bottom. More often than not at these levels you can be no more than 50% sure that things will go your way. Technical analysis is about being patient; watching and waiting for the weight of evidence to be in your favour, increasing your certainty in a trade’s potential to deliver the rise that you are looking for (or fall if you are trading short). As they say, “trade what you see, not what you want to see”. Try our research trial to see how we highlight to clients key levels on stocks, indices and commodities each day.
Mike van Dulken, Head of Research
This research is produced by Accendo Markets Limited.
Research produced and disseminated by Accendo Markets is classified as non-independent research,
and is therefore a marketing communication. This investment research has not been prepared in accordance
with legal requirements designed to promote its independence and it is not subject to the prohibition on
dealing ahead of the dissemination of investment research. This research does not constitute a personal
recommendation or offer to enter into a transaction or an investment, and is produced and distributed for information purposes only.
Accendo Markets considers opinions and information contained within the research to be valid when published,
and gives no warranty as to the investments referred to in this material. The income from the investments referred to may go down as well as up,
and investors may realise losses on investments. The past performance of a particular investment is not necessarily a guide to its future performance.
Prepared by Michael van Dulken, Head of Research