 There is a lot of talk on the news about the oil prices, OPEC, Iran, US sanctions and Russia. Brent and WTI have broken through 4-year highs in May and there is still plenty of buzz surrounding the oil market. But that’s the big picture. I’m interested in what moves individual oil shares on a more micro level. This is what I wanted to share.
Like all commodity-linked companies, UK Index Energy giants like BP and Royal Dutch Shell obey the laws of supply and demand. Company earnings (past or future) are the biggest driver of almost any share price and the oil majors’ share prices are directly linked to average realised prices of crude oil that they can sell.
There are plenty of macro factors that move oil prices, including geopolitics, sanctions, production disruptions, major discoveries of new wells, exploration and development. And that’s just the supply side. There are important drivers on the demand side as well, such as economic conditions, weather, demand for petrol and heating oil, even people’s attitudes toward air and motor travel. All of these high-level impetuses can drive the crude oil prices and, conversely, share prices of major oil companies.
That’s the macro level. But what about more day-to-day trading? If there is no news of production disruptions or major decisions to loosen the oil production spigots, what moves BP’s or Shell’s share price then? What do oil traders and UK Index Energy investors pay attention to?
The single most important weekly oil document that oil investors follow is the Weekly Petroleum Status Report published by the US Department of Energy’s Energy Information Administration (EIA). Every week on Wednesday, at 3:30pm, EIA releases its latest figures of crude oil, gasoline and distillate inventories for the previous week.
That number and the market’s expectations for it are the major weekly drivers for oil producers’ share prices. The more crude oil is stockpiled in warehouses, the less demand there is for energy consumption. The less demand for crude oil, the lower the oil price. The lower the oil price, the lower energy company shares.
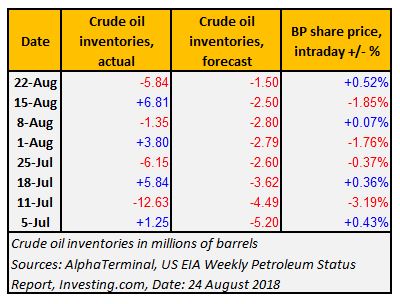 Have a look at the table below for the correlation between weekly rise/fall in US crude oil inventories and BP’s share price move on the same day. Pay especially close attention to how the share prices move depending on whether the actual data was similar to market forecast, or if it was significantly different from consensus expectations. The bigger the difference, the bigger the potential share price move.
Note that the biggest share price moves are correlated with biggest divergences between market expectations and actual figures. When a market expects an inventory drawdown (which typically signals higher demand for oil), but there is actually a large build in inventories (which typically signals lower demand), oil prices can move very sharply, often dragging UK Index Energy shares together with them.
Reaction of shares like BP and Royal Dutch Shell to release of EIA Weekly Petroleum Status Report can be quite literally instantaneous, as soon as the report is published at 3:30pm. Stock brokers and energy sector investors keep a very close eye on the data and study forecasts beforehand.
Does your broker keep you up-to-date regarding analytical data that can directly impact your equity positions? Do you think this kind of information can benefit your investment? If so, get in touch with one of our Accendo Markets brokers, so you can be in complete control of your portfolio instead of remaining at the mercy of the market. Stay informed and stay in control.
Artjom Hatsaturjants, Research Analyst, 24 August 2018