Market activity on the UK 100 continued to be dominated by coronavirus The selloff on the UK 100 continued this week after last week’s bloodbath. The week started where it ended the previous week, with more cases of the novel coronavirus (nCOVID-19) being reported around the world.
Wednesday saw some reprieve for the global stock markets, as hopes for a coordinated response from the major central banks grew. This was capped by the emergency action of the Fed by reducing interest rates in the US by 50Bps to 1.25%. This spurred some recovery on the UK 100 . However, market optimism quickly dissipated on Thursday as feelers from the BoE indicate that the bank would not be stampeded into making any emergency rate cuts.
Stocks of companies associated with the travel and hospitality sectors, as well as luxury brands continue to find the going quite tough.
The top gainers on the UK 100 for the week are:
- Polymetal International (10.13%)
- Morrison (Wm) Supermarkets (8.12%)
- Astrazeneca (8.00%)
- Sainsbury (J) (6.64%)
- Tesco (6.24%)
- Unilever (5.58%)
- Reckitt Benckiser Group (5.46%)
- Imperial Brands (5.16%)
Stocks of cruise ship company Carnival dropped 16.84% to be the UK 100 ‘s top loser, after a female elderly passenger on the Grand Paradise cruise ship died of the coronavirus. That cruise ship remains quarantined off the coast of San Francisco. Also, Carnival announced yesterday that two of its units were cyber-attacked in May 2019, further compounding the woes of investors on this stock.
Other top losers include:
- Evraz (-15.35%)
- Informa (-14.93%)
- Tui AG (-14.82%)
- International Consolidated Airlines Group (SA) (-14.62%)
- ITV (-14.55%)
- Royal Bank of Scotland Group (-13.66%)
- EasyJet (-12.63%)
- Whitbread (-12.34%)
All price gains and losses are current as at 10.50am GMT.
Technical Outlook for UK 100
The UK 100 continues to be in the red this week, as concerns over the spread of the coronavirus continue. In the UK, the Premier League has placed a temporary ban on the customary handshake before games; this shows the extent of concern over the problem.
UK 100 Weekly Chart: March 6, 2020
The price action on the daily chart reveals that the presence of a small ascending channel, which encapsulates this week’s price action. Friday’s bearish start to the trading session has taken the UK 100 below this channel in an intraday violation. However, the UK 100 needs to confirm this move. A 3% penetration close below the channel on the weekly chart or a double successive daily candle close below this channel is the confirmation required.

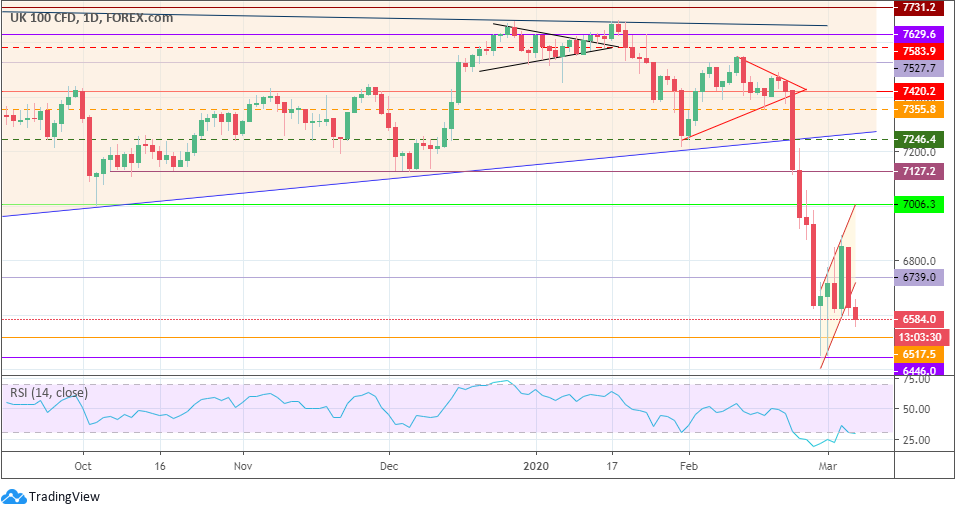
UK 100 Daily Chart: March 6, 2020
The 4-hour chart shows a clearer picture of the intraday price action, where we can see the UK 100 heading steadily lower. The RSI continues to point downwards and still has room for a run to the oversold area.
Sellers would be looking for a confirmation of the channel breakdown. This would open the path towards the short-term support target at 6517.5 (7 Nov 2016 and 26 Dec 2018 lows). This support was tested last week but held firm; another test looks likely. A breakdown of 6517.5 allows 6446.0 to come into play, being the previous lows of 6 July 2015. Below 6446.0, further support lies at 6373.5, 6204.6 and 6015.5.
On the flip side, if 6517.5 continues to hold, then a pullback towards 6739.2 (28 Jan 2019 low and lower barrier of channel) could be the next resistance target. Further recovery brings 7006.3 into focus; a possible price target if price re-enters the channel.
Bulls
A return to bullish action has to be followed by a break of 7006.3 to the upside.
Bears
A breakdown of 6517.5 opens the door for more downside on the UK 100 .
Prices to watch: 7006.3 (bulls) and 6517.5 (bears).