The UK 100 has had a pretty lackluster week, filled with mostly choppy price action which has left it little changed from where it ended last week. However, the UK 100 is still modestly up for the week, trading at 7426.5 as at the time of filing this analysis report.
Price action on the UK 100 continues to be dominated by headlines regarding the coronavirus (now named COVID-19) outbreak. There is yet no significant breakthrough with regards to finding a cure or a vaccine, and the Chinese government continues to struggle to contain the outbreak. Despite the outcome of containment measures, investors in the global stock markets are now starting to worry about the long-term impact of the outbreak on economies around the world. UK consultancy group Oxford Economics is projecting that the outbreak could cost the global economy a whopping $1.1trillion in lost output, if significant spread outside China were to occur. The consultancy group has rolled out a model in which it says that the enforced factory closures were beginning to squeeze economies around China, with top companies finding it increasingly harder to source components for their products.
UK company Jaguar has already warned that its stockpile of car parts would be exhausted by next week if supplies do not resume from China. This week, Apple announced that it believed the coronavirus outbreak would negatively impact its 2nd quarter earnings guidance. This warning caused an upheaval in US markets. China has also had its GDP forecasts for the year cut from 6% to 5.4%. Bloomberg economics expects the first quarter GDP for China to come in at 4.5%.
These concerns have largely weighed on the UK 100 , as investors continue to seek safe haven assets. Gold is now trading at 7-year highs as a result.
This week gainers on the UK 100 are led by NMC Health, which has gained 11.1% to continue to hold the top spot for the 2nd week in a row. Other top gainers include:
- Centrica (11.09%)
- Flutter Entertainment (7.63%)
- Smith & Nephew (6.21%)
- Intercontinental Hotels Group (6.07%)
- AstraZeneca (5.01%)
Companies such as Reckitt Benckiser and Hargreaves Lansdown are up by 1.36% each.
The losers’ chart is populated by companies such as Lloyds Banking Group, which is down 1.8% after it reported a drop in its 2019 full year profits. The top losers are:
- AVEVA Group (-6.0%)
- Imperial Brands (-5.8%)
- Burberry (-5.38%)
- Glencore (-4.37%)
- HSBC Holdings (-4.02%)
- Royal Bank of Scotland Group (-3.66%)
All price gains and losses are current as at 11:08am GMT.
Technical Outlook for UK 100
The UK 100 was unable to attain last week’s price top and choppy price movement has reduced the weekly candle to a doji which is at levels that are not too far above last week’s close. Therefore, the support level recorded at 7420.2 remains intact, as does the 7527.7 resistance level above it.

UK 100 Weekly Chart: February 21, 2020
The price action on the daily chart reveals the choppy nature of this week’s price action. This is also an indication of how responsive the UK 100 has been to coronavirus-related headlines. One day, the markets could have a risk-on sentiment and the next day, risk aversion takes over. This has been the story of the UK 100 ’s week.
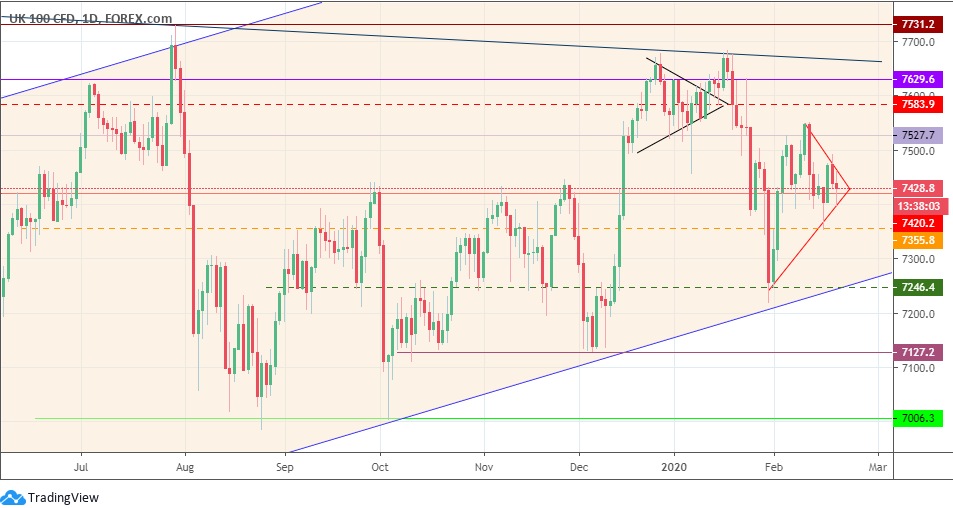
UK 100 Daily Chart: February 21, 2020
Even as the technical levels identified in previous analyses remain intact, the price activity over the last month lies within a broad symmetrical triangle. Heading into next week, we would be looking out for a possible break from any of the boundaries of this triangle to see where the UK 100 is headed.
Support continues to remain at 7420.2. A breakdown of the triangle could produce a breakdown of the 7420.2 support, which targets a short-term support at 7355.8, before targeting the medium-term support at 7246.4. The lower border of the ascending channel continues to interact with the 7246.4 price level. Below this level, other support areas could become relevant. The 7127.2 price level (previous lows of 9/10 October and last week of December 2019) as well as 7006.3 (previous lows of 25 August and 3 October 2019) are the sequential targets for the UK 100 if the ascending channel’s lower boundary is taken out by bearish price action.
On the flip side, a bounce from the 7420.2 support could allow the UK 100 breakout of the triangle’s upper boundary, presenting 7527.7 as the next resistance target. A break of 7527.7 brings 7581.9 into focus, with further resistance located at 7629.6.
Bulls
The starting point of the trace of the triangle commences at the Feb 13 price high, located just above 7527.7. This is the boundary bulls must break for continued upside push.
Bears
Bears need to see a breakdown of 7420.2 and 7355.8 so as to bring the the channel’s lower border at 7246.4 into focus.
Prices to watch: 7527.7 (bulls) and 7355.8 (bears).