The UK parliament has finally agreed on an election date: December 12. This news has been greeted with some enthusiasm by traders on the UK 100 . The index was also buoyed this week by optimism around stock markets all over the world, which responded to several positive news feeds from the US-China trade situation.
However, the UK 100 suffered a setback on Thursday after it was revealed that the Bank of England’s monetary policy committee decision to hold interest rates at 0.75% had two dissenters who voted for a rate cut. The FSTE touched an intraday high of 7431.90 before retreating to end the day at 7405.60.
This week has been very positive for the UK 100 as it has had 4 straight winning days. This week’s winning stocks (at time of writing) have been Ashtead Group PLC, BAE Systems (3.93%), Burberry Group (3.21%), Intertek Group (5.65%) and the best performing stock, Fresnillo (8.26%).
Losers include Sainsbury (6.05%), RBS (5.84%), Prudential PLC (5.37%), Royal Dutch Shell (4.11%), Vodafone Group PLC (2.36%), Tesco (2.49%) and Kingfisher (3.22%). NMC Health PLC has been this week’s biggest loser, shedding 13.13%.
Technical Outlook for UK 100
The most recent price action on the monthly chart continues to trend upwards within the context of the up channel. However, the weekly chart shows the presence of horizontal resistance (7420.2) and support levels (7127.2 and 7006.3) within the channel. These levels have been respected in the last 4 weeks and have been respected once more this week, as the upward march of price action was stopped at resistance.
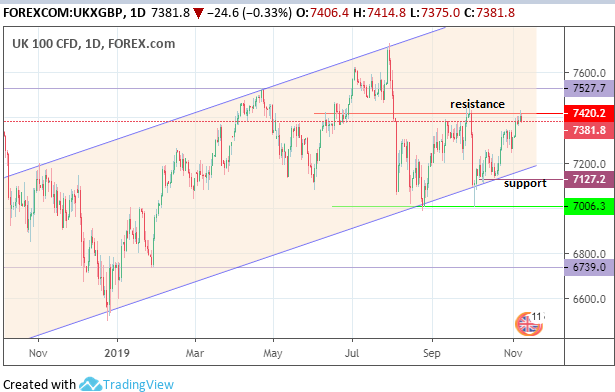
UK 100 Weekly Chart: November 7, 2019
Outlook for UK 100
Price continues to trade within the range identified last week, which has a floor of 7127.2 and a ceiling at 7420.2. However, a break of 7420.2 opens the door to 7527.7 (highs of the weekly candles of March 18 as well as May 6, 13 and 20). This would require a conclusive close of the weekly candle by a 3% penetration or a double candle close on the daily chart to confirm the upside breakout. The channel’s upper border can only be targeted by price action if these successive resistance areas are breached.
On the flip side, a downside break of 7127.2 will violate both the floor of the range and the channel’s trendline, which sets up a channel breakdown scenario. In that situation, there must be a double candle close or a 3% penetration to the downside to confirm such a break. This then opens the door to the 7006.3 price level (previous lows of the weekly candles of August 19 and August 26).
However, the UK 100 futures have started Friday on a lower tone, which may keep prices range-bound for yet another week.
Bulls
For bulls, the price to watch remains 7240.2. A break of this level is required for further upside to 7527.7 and beyond.
Bears
Bears need the UK 100 to dip below 7127.2 in order to confirm the breakdown of the channel and further downside to 7006.3 and 6739.0.
Prices to watch: 7240.2 (bulls) and 7127.2.5 (bears).