The UK 100 has had a bad week leading up to the UK elections on December 12. A lot of this week’s underwhelming performance of the UK 100 could be ascribed to the risk-off sentiment assumed by global stock and commodity markets on Monday and Tuesday. This was after a dampening of the mood around the US-China trade situation, following comments from US President Donald Trump about preference for signing any trade agreements with China after the 2020 elections. Comments from the Chinese side of things did little to help the situation, leading to a selloff on major global stock exchanges for most of the week.
After opening the week at just above 7340, the UK 100 is now trading at 7163.3, with some of the losses being offset by a higher opening this Friday morning.
The top gainers for this week were not able to gross the kind of percentage share price increases of last week. However, we see the following companies among the top gainers on the UK 100 for the week:
- British Land Co (3.98%)
- JD Sports Fashion (3.84%)
- NMC Health (2.93%)
- Polymetal International (2.47%)
- Sainsbury (1.28%)
- United Utilities Group (1.21%)
Glencore led the way as this week’s biggest loser, dropping 12.02% on its share price after revealing that it was under investigation from the Serious Fraud Office on “suspicions of bribery in the conduct of business”. Other losing stocks on the UK 100 this week include:
- Ocado Group (-7.70%)
- Evraz (-7.33%)
- Vodafone Group (-6.00%)
- InterContinental Hotels Group (-4.63%)
- Prudential (-4.58%)
- BAE Systems (-3.52%)
- Coca-Cola (-3.43%)
- HSBC Holdings (-3.39%)
Technical Outlook for UK 100
The progressively lower tops on the monthly chart have not been challenged recently and therefore the long-term outlook remains unchanged.
However, a look at the weekly chart shows a significant change from the price action situation of last week. The divergence situation noticed on the daily chart has finally been corrected, with price following the DeMarker oscillator to the downside.
On the weekly chart, it can be seen that this week’s bearish move has broken below the 7246.4 support level, but was able to find support at 7127.2 (previous lows of June 3, Oct 9 and October 18). In doing so, the active weekly candle also violated the lower border of the ascending channel. However, the weekly candle needs to close and the relationship between the closing price of this candle and the channel’s trendline assessed in order to know if a breakdown has occurred. A 3% penetration close of the weekly candle below the channel’s lower border has to occur before confirmation of a breakdown can be made.
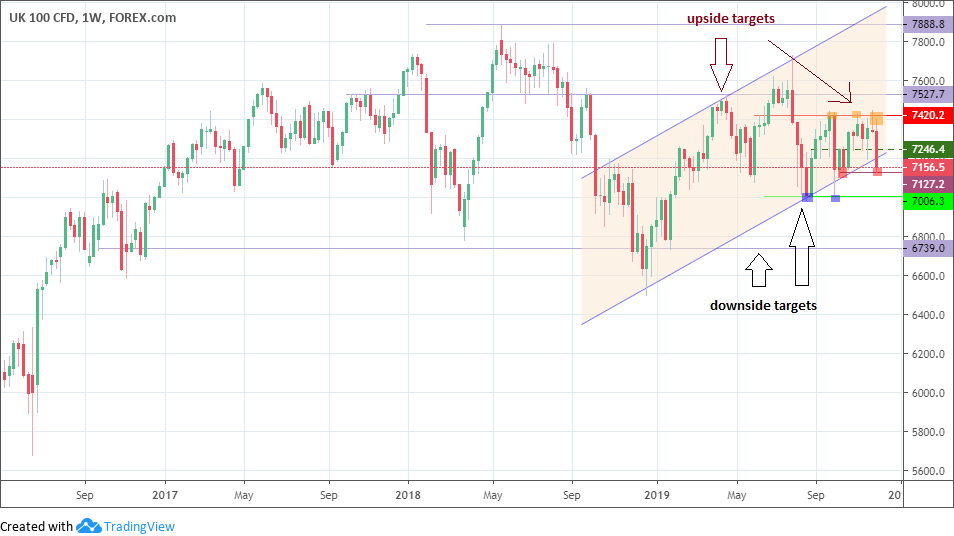
UK 100 Weekly Chart: December 6, 2019
Further support is seen at 7006.3 (previous lows of Aug 25 and October 3) and also at 6739 (previous low of January 27).
To the upside, the previous support levels of 7246.4 and 7127.2 have now reversed roles and serve as the initial resistance areas to any price recovery. Further ahead, we also have the previous resistance levels of 7527.7 (previous weekly candle highs of March 18, May 6, 13 and 20) and 7888.8 (previous high of May 18, 2018).
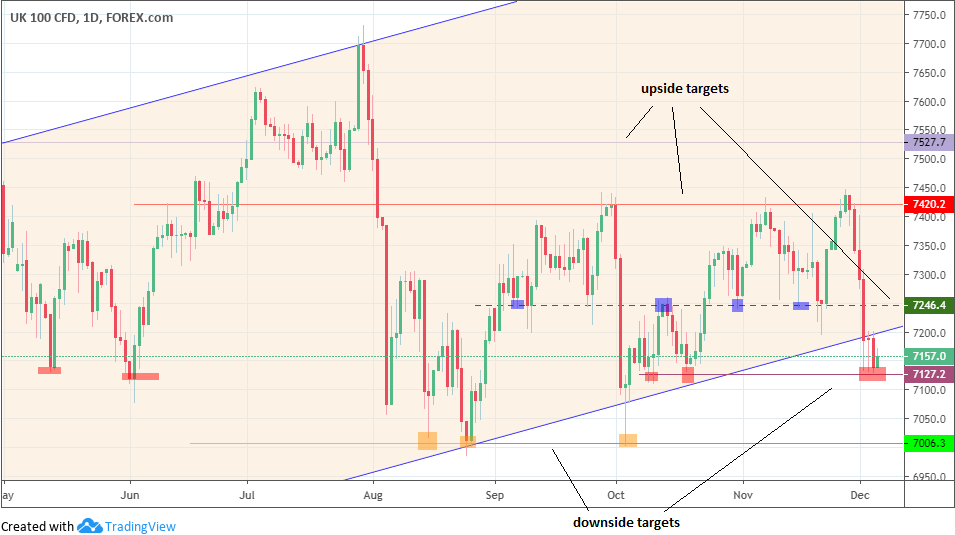
UK 100 Daily Chart: December 6, 2019
The daily chart provides a clearer picture of the situation. Thursday’s daily candle broke below the channel’s lower border after successive tests of the 7127.2 support by the candles of Tuesday and Wednesday.
A daily close today below the channel’s lower border would confirm the breakdown of the channel. However, we need to see a definitive close below the 7127.2 support line for the door to be opened for further downside push towards 7006.3 A further breakdown of 7006.3 targets January 27’s low of 6739.0.
On the flip side, a price bounce at 7127.2 opens the door for two possibilities. First possibility is a retest of the channel border initially in a pullback move, where rejection at the channel border leads to further downside that will target 7006.3. The second possibility is that price could return into the channel, where a retest of 7246.4 is likely. A break above 7246.4 will then continue the march towards 7420.2. This move then invalidates the channel break.
Bulls
Bulls would be waiting for an upside break of 7246.4 for price recovery that ticks upwards within the confines of the ascending channel.
Bears
Bears would now have to look for a downside break of 7127.2, which then targets 7006.3 and 6739.0.
Prices to watch: 7246.4 (bulls) and 7127.2 (bears).