This week saw some upside recovery on the UK 100 , largely as a result of market expectations that the stimulus packages being launched by central banks in response to the COVID-19 coronavirus outbreak would kick in soon. Market participants are watching the US, which now has the highest number of coronavirus cases worldwide, for direction. This direction comes from the $2 trillion stimulus package being proposed by the Trump administration, and which has been passed by the US Senate and awaiting ratification from the House.
Domestically, the UK 100 was stung on Friday by reports that the UK Prime Minister Boris Johnson has tested positive for the coronavirus. This is coming a few days after Prince Charles also tested positive for the virus. The UK 100 is presently down 4.71% on the day, but still retains a 10.19% gain for the week as at the time of writing, boosted by strong gains posted from the hospitality and luxury goods companies. It is no surprise that this week’s top two top-performing stocks are companies that operate in these spheres. Oil stocks are also staging a rebound as a result of a slight increase in the price of Brent crude oil.
The top gainers for the week so far are:
- Intercontinental Hotels Group (29.66%)
- Jd Sports Fashion (29.63%)
- Legal & General Group (27.98%)
- Whitbread (27.89%)
- Royal Dutch Shell (26.39%)
- Phoenix Group Holdings (26.30%)
- Meggitt (24.97%)
- Standard Life Aberdeen (24.63%)
- Prudential (23.96%)
- BP (23.82%)
The top losers for the week are:
- Ocado Group (-10.38%)
- Centrica (-7.87%)
- Land Securities Group (-7.44%)
- British Land Company (-6.81%)
- Croda International (-5.70%)
- HSBC Holdings (-5.54%)
- Unilever (-5.39%)
- Morrison (Wm) Supermarkets (-4.93%)
- Rentokil Initial (-3.86%)
All prices are current as at 12.16 am GMT.
Technical Outlook for UK 100
Today’s price analysis will be done on the daily chart, as this presents better price information than the weekly chart. The daily chart for the UK 100 shows that the active daily candle is stalling the UK 100 ’s march to break the 5811.9 resistance line. This resistance was able to beat back the price level violation of Wednesday’s candle, but was surmounted by yesterday’s price move. There has to be a time filter confirmation for a break of 5811.9 to be confirmed, and this must come from two successive daily candle penetration closes above that resistance area.
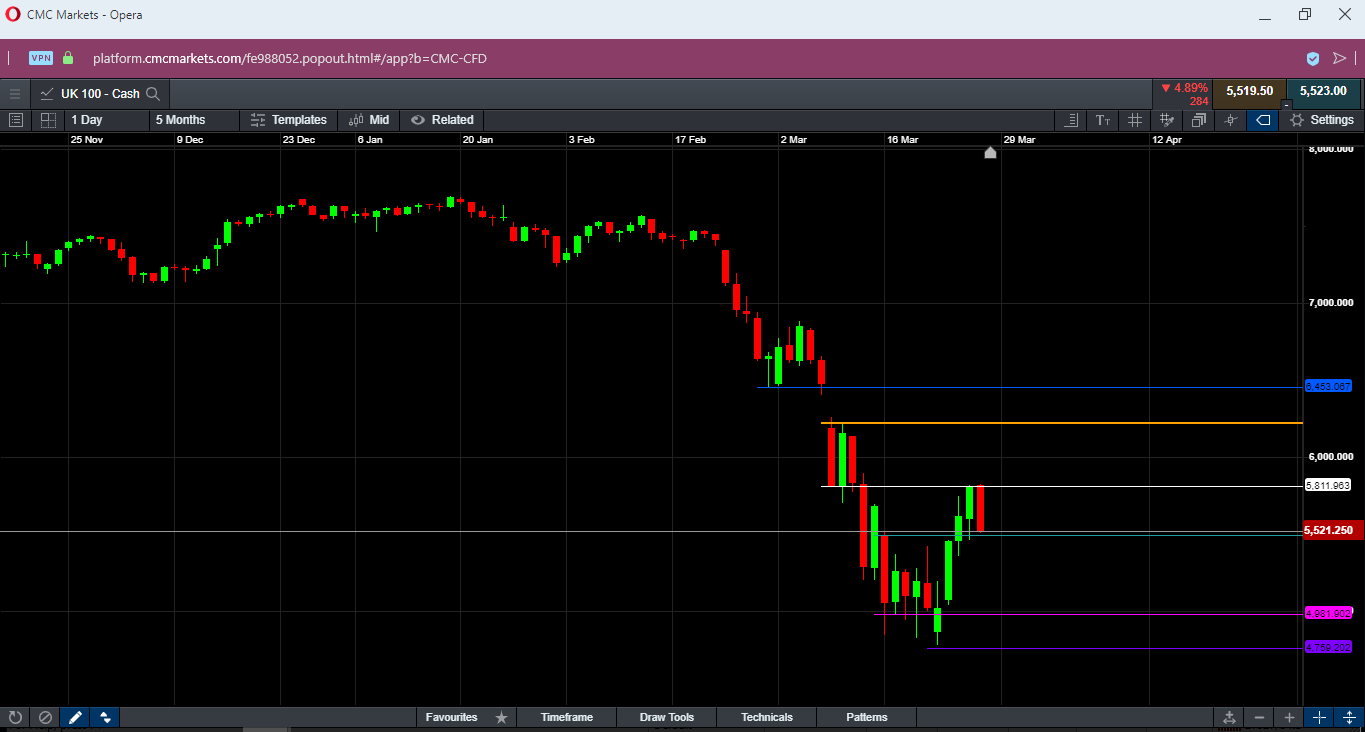
UK 100 Weekly Chart: March 27, 2020
Therefore, traders will be watching to see whether the bulls can snatch back the momentum for the day on the UK 100 . If they are able to do this and cause the UK 100 to close above the 5811.9 resistance, then the pathway will be open for price action to test the 6233.40 resistance, formed by the highs of last week and the week ended Mar 13. Above this area, the resistance formed by the 6453.06 price level could become relevant if recovery continues.
On the flip side, a failed break of 5811.9 could allow the UK 100 to retest price levels it had broken on its way back up. These price levels are at 5275.7 and the cluster of lows at 4981.9. Below this area, the 4759.7 support level (1 August 2011 and 23 March 2020 lows) lurks underneath.
As usual, the coronavirus situation in the UK is expected to dominate price action in the week ahead, so price action will continue to remain dynamic.
Bulls
A break of 5632.9 could usher in a continuation of the price recovery on the UK 100 .
Bears
A breakdown of 5203.6 is required for further bearish activity on the UK 100 .
- Prices to watch: 5632.9 (bulls) and 5203.6 (bears).
This research is produced by Accendo Markets Limited. Research produced and disseminated by Accendo Markets is classified as non-independent research, and is therefore a marketing communication. This investment research has not been prepared in accordance with legal requirements designed to promote its independence and it is not subject to the prohibition on dealing ahead of the dissemination of investment research. This research does not constitute a personal recommendation or offer to enter into a transaction or an investment, and is produced and distributed for information purposes only.
Accendo Markets considers opinions and information contained within the research to be valid when published, and gives no warranty as to the investments referred to in this material. The income from the investments referred to may go down as well as up, and investors may realise losses on investments. The past performance of a particular investment is not necessarily a guide to its future performance.