Action on the UK 100 for this week was mostly dominated by the Brexit headlines. Last week ended with expectations of the parliamentary vote on what was dubbed as Super Saturday. Alas, there was nothing really super about the Saturday as a change of events occurred, leading to the postponement of the vote to Wednesday.
The outcome of the vote has paved the way for a Brexit extension and the UK 100 has responded positively to this outcome by staging perhaps the strongest weekly performance in a long while. As at the time of writing, UK 100 futures were trading at 7325.50, 178.4 points higher than its open for the week.
The UK 100 ’s big gainers for the week have been AstraZeneca (7.07), which posted better-than-expected earnings on Thursday. Other weekly gainers on the UK 100 include AVEVA Group (6.69), Standard Chartered Plc (6.46), Centrica Plc (5.59), BP (4.45), Glaxo SmithKline (4.09) Aviva Plc (4.0), Burberry (3.42) and BAT (2.93).
This week’s top losers include Smith & Nephew Plc (-7.89), Prudential Plc (-4.87), Whitbread Plc (-3.92), Rolls Royce Holdings (-3.78), Royal Bank of Scotland Group (-2.71) and Associated British Foods (-2.01).
Technical Outlook for UK 100
Trade volumes on the UK 100 picked up this week once it became clear that Brexit would get an extension; a situation which the markets accepted in a consolatory fashion as it has reduced the odds of a no-deal Brexit.
The UK 100 is still nowhere near the lower highs on the monthly chart. These lower highs (descending red trendline) point to a stalling of the long-term uptrend. This has given rise to the range movement that has occurred within the channel on the monthly chart.
The medium-term outlook is showcased on the weekly chart. We can see a smaller up channel which has formed within the bigger channel. This week’s price action has bounced off the lower border of this smaller channel, and has pushed above the channel’s return line, threatening a breakout here.
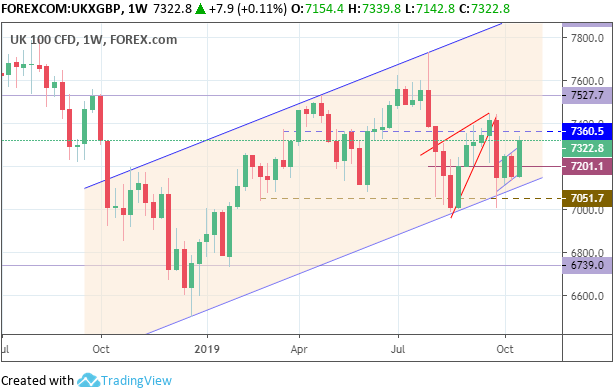
UK 100 Weekly Chart: October 25, 2019
There needs to be a conclusive close of the weekly candle by a 3% penetration to confirm the breakout, which would see price aiming for the horizontal resistance at 7360.5. The weekly candle has effectively pushed through the previous horizontal resistance at 7201.1 (highs of August 22 and October 9). Barring any last minute selloffs, it is safe to say that this level has been broken effectively. This action converts the 7201.1 level into a support as per role reversal.
The daily chart confirms the outlook on the weekly chart. This week’s price action is revealed more clearly, indicating that the UK 100 is well on its way to completing a 5-day winning streak, barring any last-minute selloffs on Friday.
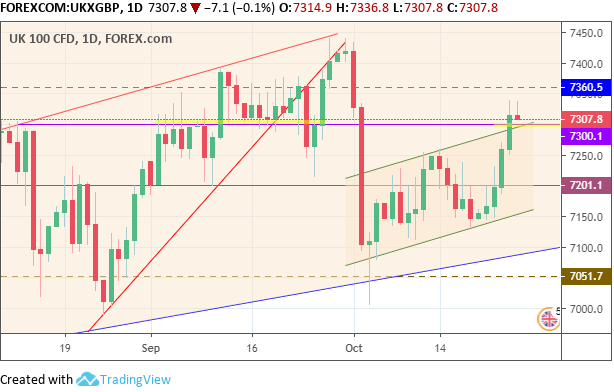
UK 100 Daily Chart: October 25, 2019
Seeing that the upper channel border was only violated yesterday, we need to watch to see if today’s candle will reflect a pullback action or whether it will keep marching higher.
Outlook for UK 100
In the near term, all roads now lead to the 7360.5 resistance level. Further upside on the day will challenge this level, which could then lead to a further breakout, or a rejection (which will lead to a pullback to the channel’s broken upper border (return line).
In the medium term, 7527.7 remains the major upside target (highs of the weekly candles of March 18 as well as May 6, 13 and 20). A break of the 7360.5 price level opens the door for a push to this resistance target. Failure to break 7360.5 could see a return to the downside to retest the 7201.1 and possibly 7051.7 if downside momentum increases.
Bulls
Within the context of the weekly chart, bulls will wait for a break above 7360.5 (November 207 highs), which clears the pathway to 7527.7. Near-term, a pullback to the broken channel border at 7300 (shaded yellow area) provides a re-entry opportunity.
Bears
In the medium term, bears would hope for a rejection at the 7360.5 resistance, which opens the door for retest of 7201.1 and quite possibly 7051.7 (if downside momentum is strong). Near-term bears would aim for a rejection at 7360.5, with a possible breakdown of the move to take price back into the channel and then to the lower channel border at sub-7200.
Prices to watch: 7300 (bulls) and 7360.5 (bears).