The UK 100 has had a topsy-turvy week featuring lots of choppy price action. The UK 100 index started the week on a bullish note, then dropped steeply by midweek. The dip in midweek was as a result of the dampening of the market mood from negative news surrounding the US-China trade situation, as well as the 8% drop in shares of Kingfisher after a disappointing earnings report.
However, the UK 100 is staging a recovery this Friday and is currently trading at 7319.0, buoyed by strong gains from companies such as Centrica and British American Tobacco. The weaker-than-expected numbers for the UK manufacturing and services PMI data do not seem to be hampering the bullish market mood today.
Among this week’s top gaining stocks are the following companies:
- Centrica (10.35%)
- BAT (4.99%)
- NMC Health (4.67%)
- Intertek Group (4.61%)
- Sainsbury (3.64%)
The top losers for the week include:
- AVIVA (-8.61%)
- Fresnillo (-6.36%)
- Rolls-Royce Group (-5.69%)
- Burberry Group (-5.34%)
- Pearson (-4.16%)
Technical Outlook for UK 100
The long-term outlook remains unchanged. The progressively lower tops on the monthly chart signify a stall in the uptrend, but there have not been significant moves to the south to kick in a trend reversal.
Price action on the weekly chart continues to remain within the confines of the up channel, with the horizontal levels of support and resistance within the channel continuing to remain the dominant determinants of price movements. Thursday’s bearish move was supported at the 7246.4 support level, formed by the previous lows of September 3, September 24 and October 31. Friday’s upswing bounced from this level; this minor support continues to remain relevant heading into next week.
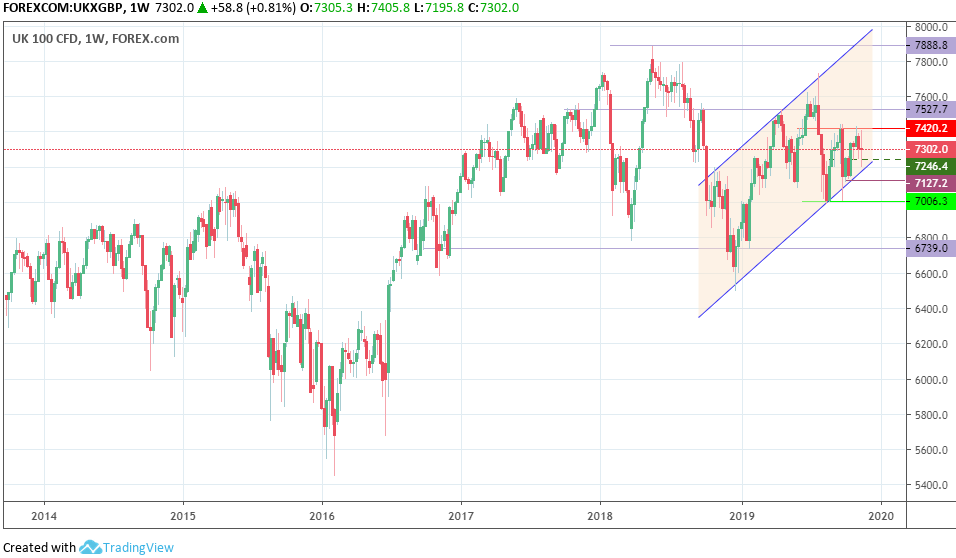
UK 100 Weekly Chart: November 22, 2019
Wednesday’s uptick was firmly resisted at the previously identified horizontal resistance located at 7420.2. This resistance also continues to remain relevant going forward. We therefore have a new range which has 7420.2 as the price ceiling and 7246.4 as the price floor.
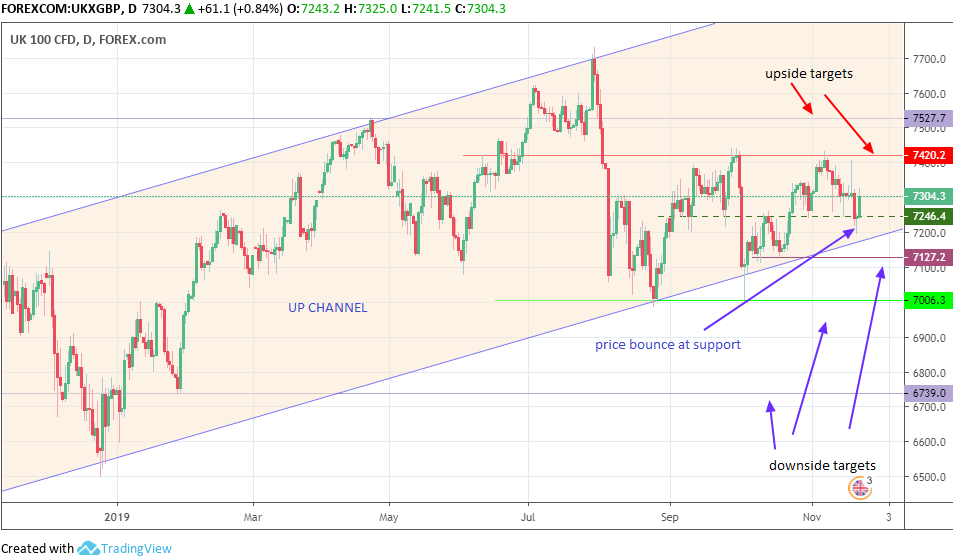
UK 100 Daily Chart: November 22, 2019
Further support is seen at the 7127.2 price area (last week’s price floor) and also at 7006.3 (previous lows of Aug 25 and October 3). To the upside, further resistance areas are seen at 7527.7 (previous weekly candle highs of March 18, May 6, 13 and 20).
A break of 7420.2 to the upside opens the door to 7527.7. A 3% penetration close on the weekly chart, or a double candle close on the daily chart confirms this move. If further upside momentum persists, a break of 7527.7 clears the way for a test of the channel’s upper border.
On the flip side, a downside break of 7246.2 will reopen the path to last week’s support located at 7127.2. Further downside momentum that leads to a break of 7127.2 to the downside breaks down the range floor and the channel’s lower border. Such a breakdown targets 7006.3.
Bulls
Bulls would be waiting for an upside break of 7240.2 for resumption of the uptrend.
Bears
Bears would now have to look for a dip below 7246.4 as well as 7127.2, which then breaks down the channel for a straight run to 7006.3 and 6739.0.
Prices to watch: 7240.2 (bulls) and 7246.4 (bears).