On Thursday, the Bank of England (BoE) voted unanimously to leave the benchmark interest rate and its asset purchase facility unchanged. The BoE took note of Brexit-related uncertainties and its concerns for global growth in making its decision. However, many experts from firms such as Rabobank and ING have noted that the narrative in the accompanying statements by the Bank of England is starting to tilt to that of extreme caution. They believe that the BoE’s continued reference to Brexit uncertainties may have scrubbed any chances of a near-term rate increase.
The lack of action on the BoE’s part, coupled with the rate hold being fully priced in by the markets provided a reaction of the UK’s stock market that can best be described as muted. The UK 100 is trading at 7319.50 (as at the time of writing), which is barely above its opening price for the week.
Price gainers on the UK 100 have been led by Lloyd’s Banking Group. Oil companies Shell and BP also benefitted from the sharp spike in crude oil prices early in the week. Sirius Minerals, Next, Cobham, Kingfisher and JD Sports are some of the companies on the loser’s chart.
Technical Analysis for UK 100
It is typical for the markets to be very quiet just before an interest rate decision, and this is what the UK 100 witnessed this week. Interest rates were kept unchanged as expected by the markets, leading to very little activity on the UK 100 on Thursday.
As we look at the weekly chart of the UK 100 , we can see that the weekly candle’s range is the lowest it has been for several weeks. Analysis shows that price therefore continues to remain in the up channel that has been formed from the most recent price action.
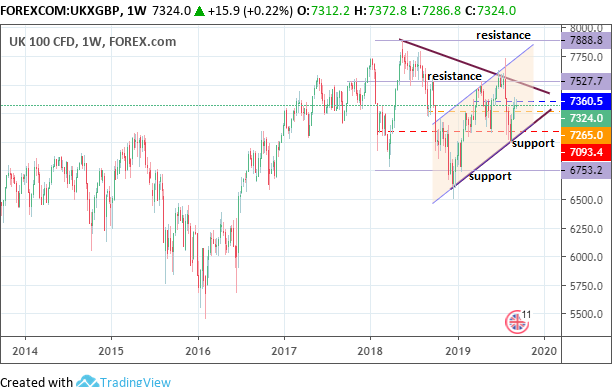
UK 100 Weekly Chart
This week’s candle has tested the 7360.5 horizontal resistance once more without breaking it. However, there is still room for further price progression on either side within the channel.
The daily chart reveals the presence of rising wedge within the channel pattern seen on the weekly chart.
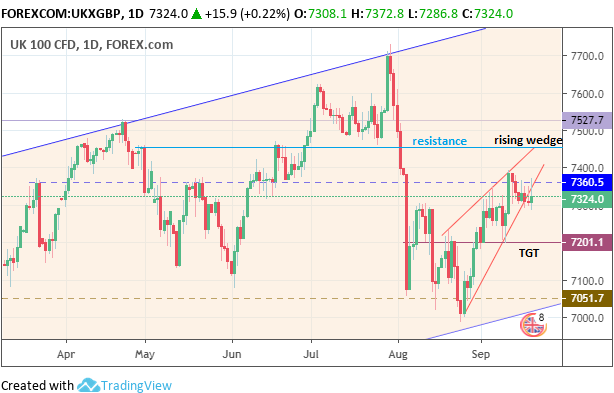
UK 100 Daily Chart
Price has already broken below the rising wedge’s lower border, but is initiating a return move which has been rejected at the broken lower border. To the downside, we see a horizontal support at the 7201.1 price level; site of a recent low seen on Sep 9. Further support is seen at 7051.7.
Bulls
Within the context of the weekly chart, bulls would be looking for a break above 7360.5 to lead the way for a push towards 7527.7 (Nov 2017 and April 2019 highs). Further upside above 7527.7 would complete the breakout from the symmetrical triangle, targeting the upper channel border as the initial target. This move would be in line with the expectations for the bullish continuation price move expected of this pattern, with 7888.3 being the long term goal.
Bears
Bears would hope for a failed break of 7360.5, which opens the door for a run towards 7201.1 in completion of the breakout move from the rising wedge pattern seen on the daily chart. A break above 7360.5 would negate the pattern. However, such a move would still encounter a pit stop at 7469 (June 18 high) or 7527.7, located at the triangle’s upper border. Price rejection there would open the door for a run to the triangle’s lower border at 7093.4, with potential pit stops to be seen at 7360.5 (Nov 2017 low) and 7265.0 (Feb 2019 low) below it.
Prices to watch: 7360.5 (bulls) and 7265.0 (bears).