Market action for the week on UK 100 has been relatively muted. The end of the 1st phase of the US-China trade talks in Washington with a yet-to-be-disclosed partial deal, also took off the risk-on/risk-off sentiment that pervaded the markets last week. This has left the UK 100 at the mercy of the Brexit headlines as well as earnings reports of the listed companies.
In Thursday’s trading, the UK 100 is up about 0.9% to 7209.48 (as at the time of writing), mostly on the announcement that a new Brexit deal had been reached.
The UK 100 had even reached as high as 7250, but the optimism that greeted the Brexit deal announcement quickly faded as reports of a rejection of the deal by the Northern Irish party DUP emerged. Support for the deal from the DUP is deemed crucial to the passage of the new deal through the UK Parliament, so the rejection of this deal by the DUP has proven to be a big deal.
Positive endings on Wednesday and Thursday’s push from its lows have been the only positives for the UK 100 , which saw a huge slump in Tuesday’s trading.
Technical Outlook for UK 100
Trade volumes on the UK 100 have been thin with a lot of cautious price action as the markets waited on the outcome of renewed Brexit negotiations. Thursday saw an initial drop in the UK 100 ’s value, but this was quickly overcome as news that a Brexit deal had been reached hit the markets. However, this upside move has been capped by the DUP position and not much positive momentum has been found since.
The lower highs on the monthly chart stall the uptrend, but they remain unchallenged as recent price action continues to trade close to the lower border of the up channel.
The medium-term outlook on the weekly chart shows that the up channel is still intact, with price action occurring within the channel itself to form a smaller channel. The latest weekly candle is bearish, indicating the return of price action from the smaller channel’s return line to its trendline. Indeed, the weekly candle bounced off the channel trendline and has pushed upwards, but not enough to cancel out the losses for the week.
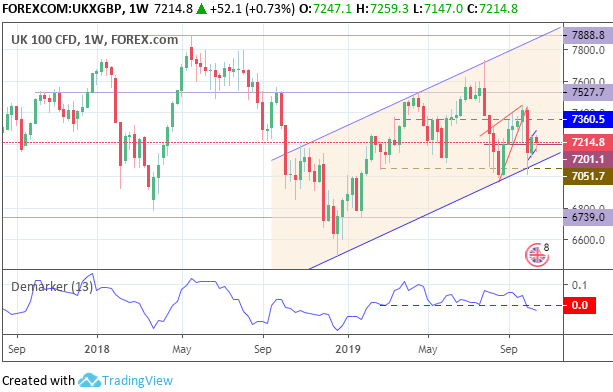
UK 100 Weekly Chart: October 18, 2019
The oscillator has turned downwards below the midway point of the indicator window, indicating that there may be more short-term downside ahead.
The horizontal resistance at 7201.1 was breached by last week’s weekly candle. However, this week’s candle is trading below it, which holds off the confirmation of an upside break. This candle needs to close for a breakout/fakeout call to be made.
The daily chart reveals the price activity on the smaller channel more clearly. This week’s price action within the smaller channel indicates that price is on its way to the smaller channel’s return line (i.e. upper border).
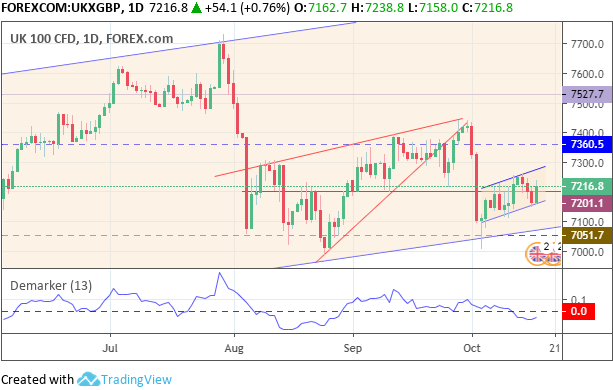
UK 100 Daily Chart: October 18, 2019
The 7201.1 resistance level remains under challenge. However, the upside break can only be confirmed if the weekly candle closes above this price area.
Outlook for UK 100
The 7201.1 price level (Aug 21/22 highs as well as Sep 2, 9 and 10 lows in role reversal) remains the key level to watch. A confirmed upside break (close of this week’s candle above this level) opens the door for a push towards 7360.5.
On the flip side, rejection at 7201.1 reopens the door for a retest of the trendline of the bigger channel (i.e. its lower border), just above 7051.7.
Bulls
Within the context of the weekly chart, bulls continue to wait for a confirmation of the break above 7201.1. This allows for a push to the return line of the bigger channel. Further upside momentum (which could come from more positive Brexit headlines) takes the UK 100 above 7360.5 and ultimately 7525.7 (Nov 2017 and April 2019 highs).
Bears
Bears would continue to hope for a rejection at the 7201.1 resistance level, which opens the door for another run towards 7051.7 and possibly a break below the bigger up channel.
Prices to watch: 7201.7 (bulls) and 7051.7 (bears).