The UK 100 has welcomed the US-China phase 1 trade deal with optimism, and this has reflected in the uptick in price movements on the index this week. Furthermore, the cooling of tensions in the middle East has calmed the nerves of investors, allowing them to focus more on the key issues confronting the UK, which is the Brexit process and trade negotiations with the EU.
This week, the top gainers chart is led by NMC Health, which is now attracting renewed buying interest by bargain hunters after its share price was battered in December 2019. Other gainers include:
- Aveva Group (7.35%)
- Taylor Wimpey (7.18%)
- Persimmon (6.49%)
- JD Sports Fashion (6.42%)
- Centrica (6.29%)
- Barratt Developments (5.61%)
The top losers for this week feature stocks like the Lloyds Banking Group, which continues to rebalance itself after the sale of a majority stake owned by the UK government in December 2019. Here is the list of the top 7 losers on the UK 100 :
- Pearson (7.85%)
- TUI AG (5.24%)
- BT Group (4.9%)
- Mondi (4.77%)
- Smith (DS) 4.31%
6, Royal Bank of Scotland Group (4.23%)
- Lloyds Banking Group (3.85%)
All price gains and losses are current as at 12:12 GMT.
Technical Outlook for UK 100
As was mentioned earlier, the UK 100 was able to get some positive momentum this week. This has allowed it to break above the symmetrical triangle that was identified on the charts in last week’s analysis piece. This has opened the door for the UK 100 to target a new resistance zone, which is located between falling trendline which connects the highs of price action from early 2018 to date on the weekly chart, and the horizontal resistance located at 7731.2.
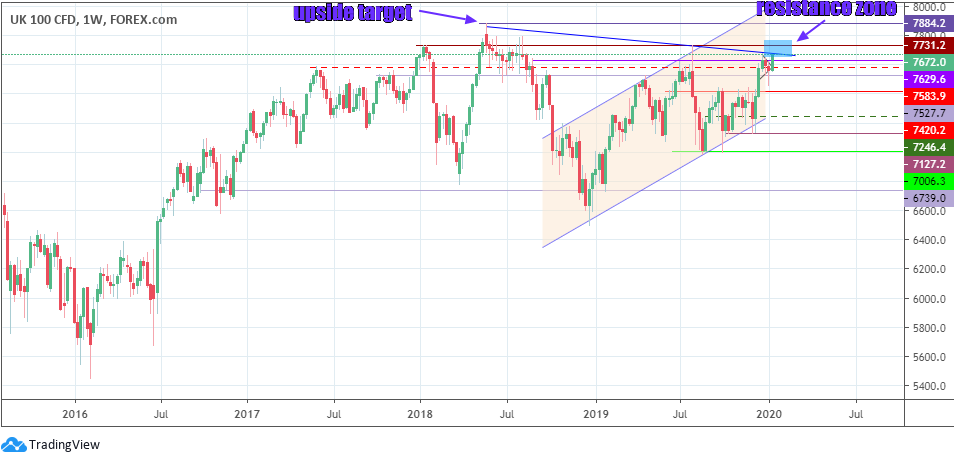
UK 100 Weekly Chart: January 17, 2020
The previous resistance zone located between 7629.6 to 7680.2 has effectively been taken out by this week’s upward push.
The daily chart reveals that the price action is presently testing the falling trendline, which forms the lower border of the resistance zone identified on the weekly chart. The breakout from the symmetrical triangle is yet to complete the measured move, which is the distance from the breakout point that is equidistant to the base of the triangle.
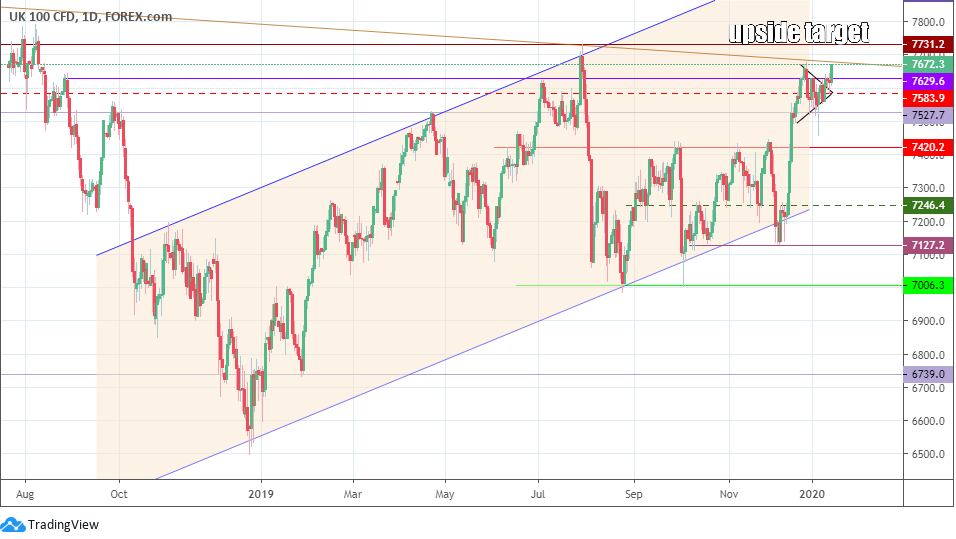
UK 100 Daily Chart: January 17, 2020
Price must break the falling trendline resistance and at least push up to the 7731.2 horizontal resistance (previous weekly highs of Jan 8 2018 and July 29, 2019 as well as a cluster of highs seen June and August 2018), for the measured move from the symmetrical triangle to be completed. Therefore, the price action of next week on the UK 100 would be critical to such a move.
Above the resistance zone, 7884.2 (previous high of May 21, 2018) remains the next upside target, after which the channel’s upper border comes into view. Looking at the price action from November 2019 till date, one may conclude that this is a bullish flag. We need to see price hitting 7884.2 for the measured move of the bullish flag to the complete. For this to happen, price must break above the resistance zone and close above this area with a 3% penetration on the weekly chart, or a double successive candle close on the daily chart.
On the flip side, role reversal of previous resistance levels seen at 7583.9 and 7629.6 converts these levels to new support areas. Previous support levels at 7527.7 (previous weekly candle highs of March 18, May 6, 13 and 20) as well as 7420.2, 7246.4 and 7127.2 remain valid. These areas could be targeted in sequence if price fails to break above the resistance zone, with 7629.6 and 7583.9 being the first in line.
Bulls
Bulls need to see an upside break of the ceiling of the new resistance zone at 7731.2 for further upside towards 7884.2.
Bears
Bears would need to see price retrace all the way down below the 7583.9 price level (red dotted line at the apex of the triangle) to invalidate the bullish recovery.
Prices to watch: 7731.2 (bulls) and 7583.9 (bears).