This week has been a topsy-turvy week for most financial markets. For the UK 100 , this was a week of muted activity. Once more, coronavirus-related headlines as well as headlines from the Brexit trade negotiations dominated headlines for the UK 100 . The week started on a bad note for the British Pound, as it emerged that France was championing a cause to relocate clearing of Euro contracts from London to a European location. Comments by Scotland’s First Minister regarding the pursuance of a second independence referendum also rattled the Pound, but had a positive effect on the market.
On the back of these events, the UK 100 started the week with a 3-day winning streak. This was interrupted only on Thursday by China’s decision to recalibrate its diagnostic parameters for patients with coronavirus infection, which had the impact of significantly increasing the case count, rattling markets globally. However, the UK 100 is in positive territory on Friday, as it attempts to claw back some of earlier gains made this week which were eroded by Thursday’s slump.
The UK 100 ’s top gainers for the week are led by NMC Health, which has gained 14.57% so far as it continues what has now become a weekly see-saw in price movements. What a rollercoaster ride holders of that stock must be having. Other top gainers include:
- Barratt Developments (8.03%)
- Persimmon (6.01%)
- Taylor Wimpey (5.93%)
- Hargreaves Lansdown (7.86%)
- Anglo-American (4.75%)
Whitbread, Kingfisher and Sainsbury are up by 3.06%, 2.71% and 2.62% for the week respectively. Llouyds Banking Group is up a modest 0.88%.
Centrica was this week’s biggest loser, shedding 14.65% as at the time of writing. Other losers are:
- Royal Bank of Scotland Group (-4.96%)
- Ocado Group (-4.88%)
- Pearson (-2.55%)
- Royal Dutch Shell (-2.45%)
- Diageo (-2.43%)
- Reckitt Benckiser (-2.43%)
All price gains and losses are current as at 11:45am GMT.
Technical Outlook for UK 100
The UK 100 ’s bullish run last week took it above the 7420.2 resistance level. The index has built on this momentum and is also up this week, but not by much as a result of Thursday’s global market selloff which eroded the gains recorded on Monday, Tuesday and Wednesday. The index currently trades at 7470.3, and looks poised to end the week slightly higher than it did the previous week.
The selloff on Thursday marked the unsuccessful test of the 7527.7 resistance level, and barrign any unforeseen bullish push in price action, it would appear that this resistance would remain intact for now.
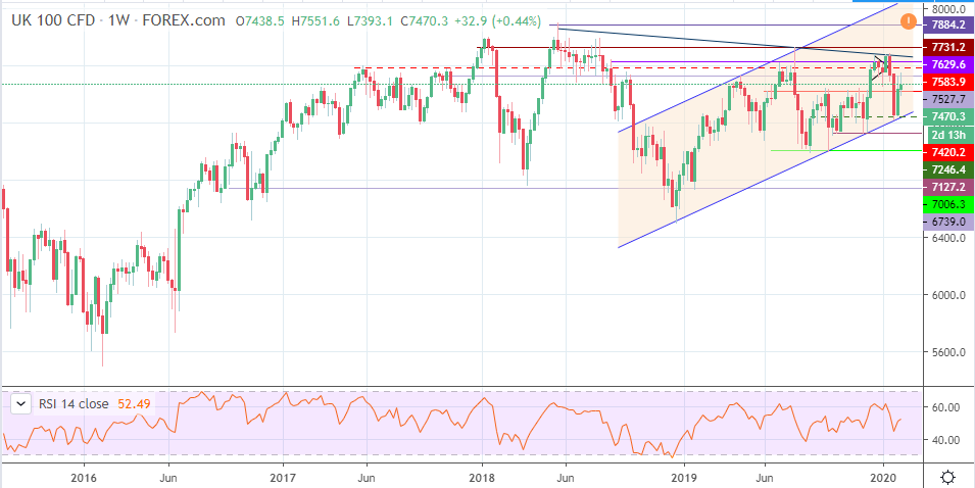
UK 100 Weekly Chart: February 14, 2020
The daily chart reveals the choppy nature of this week’s price action, and is an indication as to how the coronavirus outbreak and the headlines around it continue to swivel investor sentiment from one extreme to the other.
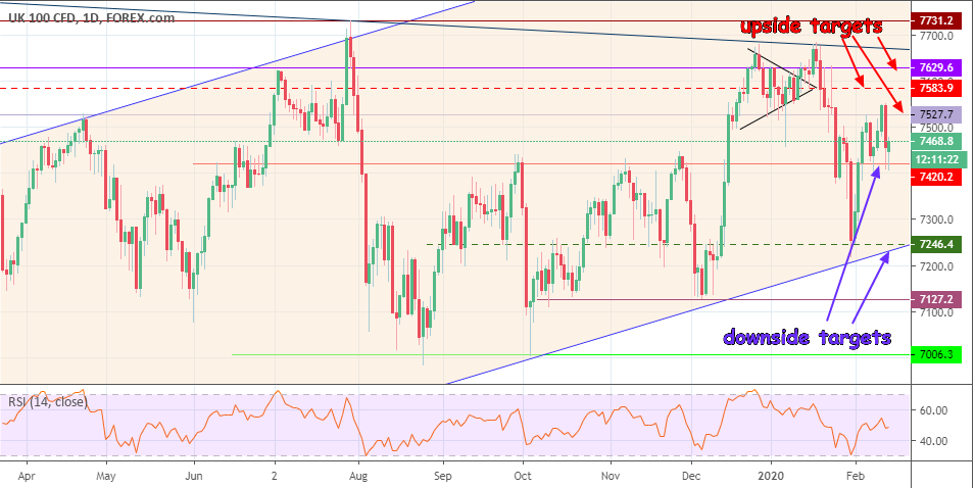
UK 100 Daily Chart: February 14, 2020
The technical levels identified in previous analyses continue to remain relevant to future price action. The support at 7420.2 continue to serve as the springboard for any bullish price action for next week. However, any bearishness which is able to break below the 7420.2 support could target the next support level below this area, which is at 7246.4. The lower border of the ascending channel continues to interact with this level. A move below the 7246.4 support breaks down the channel, allowing the UK 100 target 7127.2 (lows seen previously on 9/10 October and last week of December 2019). The 7006.3 price level (previous lows of 25 August and 3 October 2019) also becomes relevant once channel is breached to the downside.
On the flip side, a bounce from the 7420.2 support could provide renewed impetus for the UK 100 to make another attempt at the 7527.7 resistance. A break of 7527.7 by the required time/price filters makes 7581.9 the next resistance target, with 7629.6 lying overhead.
Bulls
Bulls still need price to break above 7527.7 for continued upside push.
Bears
Bears need to see a breakdown of 7420.2 so as to bring the the channel’s lower border at 7246.4 into focus.
Prices to watch: 7527.7 (bulls) and 7420.2 (bears).