The price activity on the UK 100 this week marks the steepest one-week decline in more than a decade after two events created a global market shock. The world woke up to the news of the collapse of the Saudi-Russia alliance, effectively marking the end of OOEC + as a group after the core OPEC group and the Russia-led non-OPEC bloc failed to agree on the 1.5million barrels per day output cut proposed at the start of the 2-day summit last week. Saudi Arabia vowed to punish Russia by initiating a price war; ramping up production to 10 million barrels per day and cutting prices at which crude oil was sold to its clients by as much as $8 per barrel. This drove oil prices down by nearly 34% overnight, sparking a massive global selloff in risky commodities and stock markets around the world.
The 2nd trigger is the global spread of the novel coronavirus (COVID-19), which as at the last count is now in more than 80 countries. The case count and fatalities in the UK and US are growing. The WHO has declared the disease a pandemic as cases worldwide have risen 13-fold. These data prompted the US government to issue a travel ban that will see all flights from Europe to the US suspended for 30 days. This was announced by US President Trump on Wednesday night, prompting a renewed round of selloffs.
Wednesday also saw the BoE perform an emergency 50 bps rate cut, taking the interest rate in the US down to 0.25%.
In terms of performance of individual UK stocks, airline stocks, as well as stocks of luxury brands, hotels, travel and hospitality companies as well as banking stocks continue to get hammered. The crash in crude oil prices also hit oil company stocks hard, with BP and Shell taking huge hits.
No single stock listed on the UK 100 is in positive territory for the week as at the time of writing. Top losers on the UK 100 this week are led by cruise ship company Carnival, which has so far shed 41.72% this week as travel companies continue to get hammered.
Other top losers include:
- Centrica (-36.70%)
- Tui AG (-32.88%)
- Aveva Group (-31.72%)
- BP (- 29.28%)
- Coca Cola HBC Ag (-28.88%)
- Smith’s Group (-28.53%)
- Royal Dutch Shell (-28.47%)
- Whitbread (-12.34%)
Glencore, EasyJet and International Consolidated Airlines Group were also huge losers, suffering losses of 24.30%, 23.69% and 23.42% respectively.
All prices are current as at 09.16 am GMT.
Technical Outlook for UK 100
The monthly chart reveals that the UK 100 has officially entered into a bear market and has hit lows not seen since 2013 as the index endured the biggest one-week fall in more than a decade.
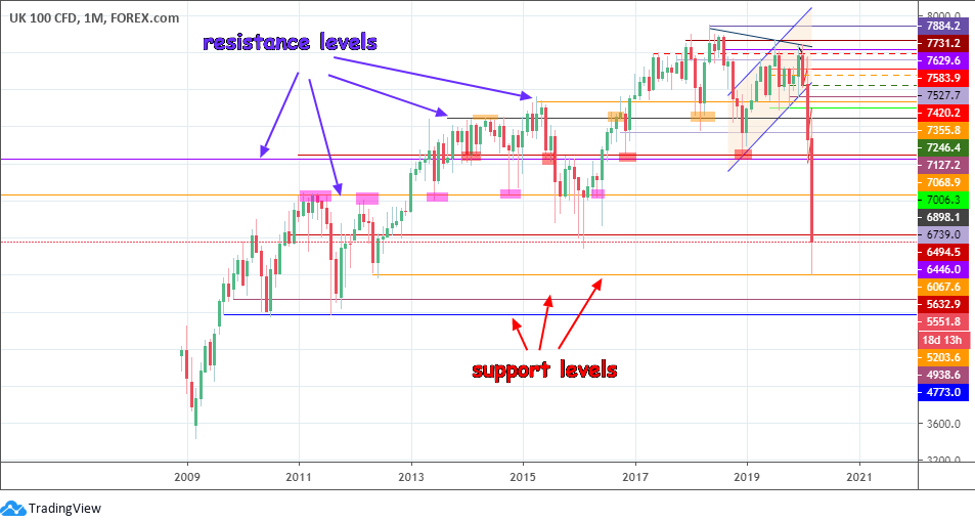
UK 100 Monthly Chart: March 13, 2020
This steep drop blew through several support levels identified in last week’s chart pictures. However, the UK 100 ’s monthly candle shows a bounce off the 5203.6 price support, which has taken it back to the 5632.9 former support, which now acts as a resistance having been broken decisively earlier in the week.
The price action on the daily chart paints the picture of this week’s price action in clearer light. The drop in price of the UK 100 has been so steep that bulls have not been able to come up with anything to counter this drop. Therefore, only support-resistance plays are possible at this time, with no discernible chart patterns or candlestick patterns to work with.
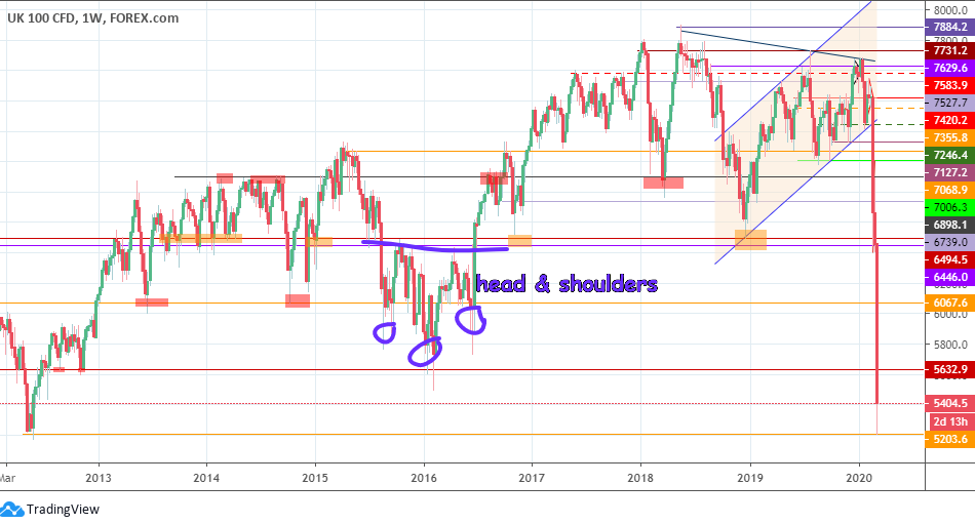
UK 100 Weekly Chart: March 13, 2020
Sentiment on the UK 100 continues to remain bearish, even though Friday has presented a little price recovery which is represented by the formation of the lower shadow on this week’s candle.
With price retracing upwards on the day, sellers would be looking for a rejection at 5632.9 (the trough of 8 Feb 2016 which forms the “head” in the inverse head and shoulders pattern). Such a rejection should also be followed by a breakdown of 5203.6 for the downside to continue.
On the flip side, if today’s price recovery can be sustained beyond the 5632.9 resistance level, then we may see further recovery attempts that target 6067.6 (troughs forming the two shoulders in the pattern), with 6446.0 (neckline) being a further target to the north.
The situation with the coronavirus pandemic and the market response continues to remain very fluid. Therefore, traders need to brace up for more dynamic price action on either side in the week ahead.
Bulls
A return to bullish action has to be preceded by a break of the resistance zone that forms between 6464.0 and 6494.5 (neckline of head and shoulders pattern).
Bears
A breakdown of 5203.6 opens the door for more downside on the UK 100 .
- Prices to watch: 6494.5 (bulls) and 5203.6 (bears).