The UK 100 has had a slow start to 2019 and is not much changed from where it signed off in 2019. The latest news from the Brexit angle is that the UK Parliament has as expected, approved the Brexit Withdrawal Agreement Bill, opening the gate to a January 31st exit from the EU and a transition period that is expected to last for a year.
The UK 100 did not change much on the news as this had already been priced in following the victory of the Conservative Party in the December 12, 2019 election. Now that Brexit has entered another stage which will feature trade negotiations, it is expected that the degree of progress on that front may be the new fundamental trigger for the UK 100 , at least for Q1 and Q2 2020.
On the international front, the killing of General Qassem Soleimani and the Iranian response caused a fall in the UK 100 earlier in the week. However, tensions have cooled off somewhat and the UK Index has clawed back some of those losses.
The top gainers for the first trading week of 2020 are:
- EasyJet (8.57%)
- International Consolidated Airlines Group (6.17%)
- British American Tobacco (BAT)
- Meggitt (3.82%)
- Imperial Brands (3.29%)
NMC Health continues to find the going very tough after a damning report by Muddy Waters that questioned its revenue figures sent the stock crashing badly in December 2019. This week, it continued its losing streak with another 21.17% loss as at the time of writing. Other top losers are:
- British Land Co (6.35%)
- Mondi (5.21%)
- Standard Life Aberdeen (4.97%)
- Morrison Supermarkets (4.5%)
- Centrica (4.34%)
- Sainsbury (3.97%)
Lloyd’s Banking Group also shed 3.92% as its price continues to undergo rebalancing following the massive divestment of the UK government from the shareholding of the bank on December 13, 2019.
Other top losers on the UK 100 this week include:
- Persimmon (-5.93%)
- Pearson (-5.23%)
- Land Securities Group (-4.69%)
- Unilever (-4.32%)
- Royal Bank of Scotland Group (-3.02%)
Technical Outlook for UK 100
A look at the weekly chart of the UK 100 reveals some new information. There is now a new trendline that connects three price tops at the weekly candles of 21 May 2018, 29 July 2019 and 23 Dec 2019. This trendline can now be considered to be a resistance line of note, as it prevented further price upside of the UK 100 after it had broken above the 7629.6 horizontal resistance line. This then defines a new medium-term resistance zone that lies from 7629.6 to 7680.2 (where the price intersects the trendline in a horizontal plane).

UK 100 Weekly Chart: January 10, 2020
We also see a tiny symmetrical triangle which has been formed by this week’s price activity. This pattern can be visualized with greater clarity on the daily chart below.
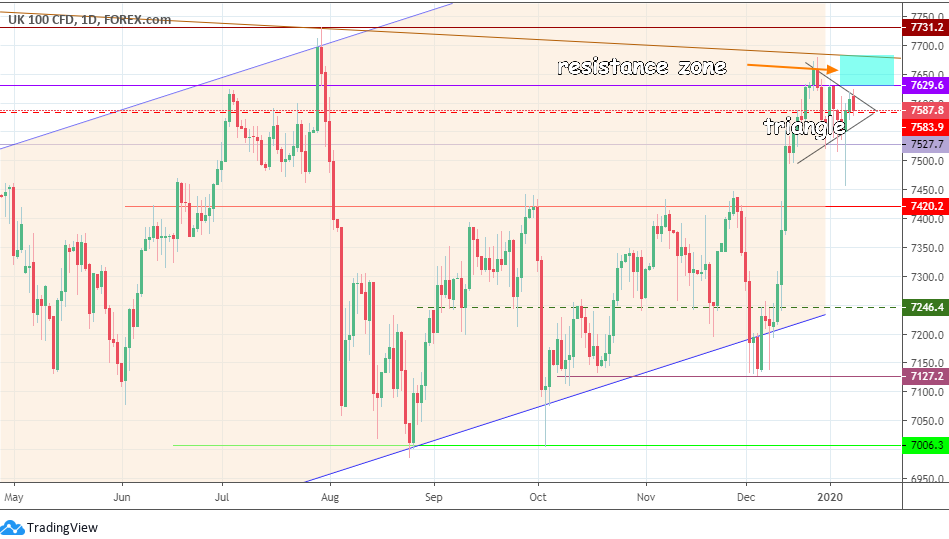
UK 100 Daily Chart: January 10, 2020
To the upside, further resistance above the blue resistance zone is expected to be met at 7731.2 (previous weekly highs of Jan 8 2018 and July 29, 2019 as well as a cluster of highs seen June and August 2018). There is also a resistance level at 7884.2 (previous high of May 21, 2018), which is where price is expected to intersect the channel’s upper border.
On the flip side, we have support at 7527.7 (previous weekly candle highs of March 18, May 6, 13 and 20). Further to the south, 7420.2, 7246.4 and 7127.2 also come into the picture as previous resistance levels that have now reversed roles and will form new supports to falling prices.
The price action of the UK 100 for the day has been rejected at the triangle’s upper border, and is now turning south. A break of the triangle to the downside will target the immediate support at 7527.7. However, this break must be confirmed by two successive daily candles closes below the triangle’s lower border. If 7527.7 is breached by a strong selloff, we may see 7420.2 come into action.
If the triangle is broken to the upside, we need to see a firm push beyond the upper limit of the resistance zone for price to be able to target the 7731.2 resistance. Otherwise, we may see price simply trading in a range within the resistance zone until either the floor (7629.6) or ceiling (7680.2) of the zone gives way.
Bulls
Bulls need to see an upside break of the ceiling of the resistance zone at 7680.2 for further advance towards 7731.2.
Bears
Bears would need to see the triangle’s lower border broken, as well as the 7527.7 support for further downside to continue on the UK 100 .
Prices to watch: 7680.2 (bulls) and 7527.7 (bears).