Global markets were able to shake off the coronavirus-related fears that pervaded the markets last week. The positive sentiment returned when the Chinese government, through the Peoples Bank of China (PBoC), injected $173billion of liquidity to stave off the market impact of the coronavirus outbreak. As the week wore on, statistics issued from various countries affected by the outbreak pointed to slower global transmission, with lower mortality rates than is presently obtainable in China.
Furthermore, the Pound suffered one of its worst weeks in a while after comments from the UK PM on the state of trade with the EU post-Brexit rattled the currency markets and sent the Pound crashing nearly 270 pips for the week. These developments allowed risky sentiment to come into play and put the UK 100 ’s stocks on bid for most of the week. The UK 100 is presently trading at 7246.6 as at the time of writing, up nearly 188 points on the week.
The UK 100 ’s top gainers for the week include the following companies:
- Evraz (11.74%)
- TUI AG (9.65%)
- Ferguson (8.22%)
- Rentokil Initial (7.86%)
- Smurfit Kappa Group (7.60%)
- easyJet (7.50%)
Some of the big stocks such as Unilever, Reckitt Benckiser, Vodafone and British American Tobacco (BAT) also made gains of 3.24%, 3.22%, 3.0% and 2.87% respectively. Tesco is 3.14% up at the moment.
NMC Health has assumed the unenviable position of leading the losers’ list on the UK 100 for the week, topping the chart with a 35.99% loss. Other stocks on the losers’ list are:
- Imperial Brands (-6.17%)
- GlaxoSmithKline (-4.80%)
- Hargreaves Lansdown (-4.32%)
- BT Group (-3.53%)
Persimmon and Lloyds Banking Group also find themselves on the losers’ chart with losses of 1.06% and 0.74% respectively.
All price gains and losses are current as at 11:00am GMT.
Technical Outlook for UK 100
The UK 100 ended the previous week at the 7246.4 support, which provided the pivot for this week’s bullish price action. This price level is also the site of the rising channel’s lower border.
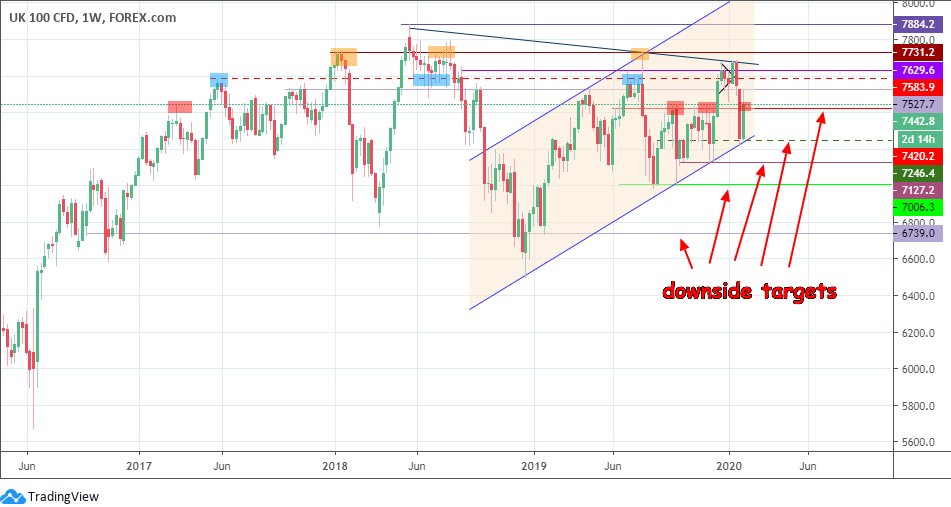
UK 100 Weekly Chart: February 7, 2020
The strong bounce seen on the UK 100 took the index all the way up to the 7527.7 resistance, before a strong rejection from Friday’s bearish price action sent the UK 100 lower. It is still higher on the week and is set to test the 7420.2 support level.
The daily chart reveals a clearer picture of the price action. Friday’s trading session has kicked off on a bearish note, allowing the UK 100 to pullback towards the 7420.2 price level.
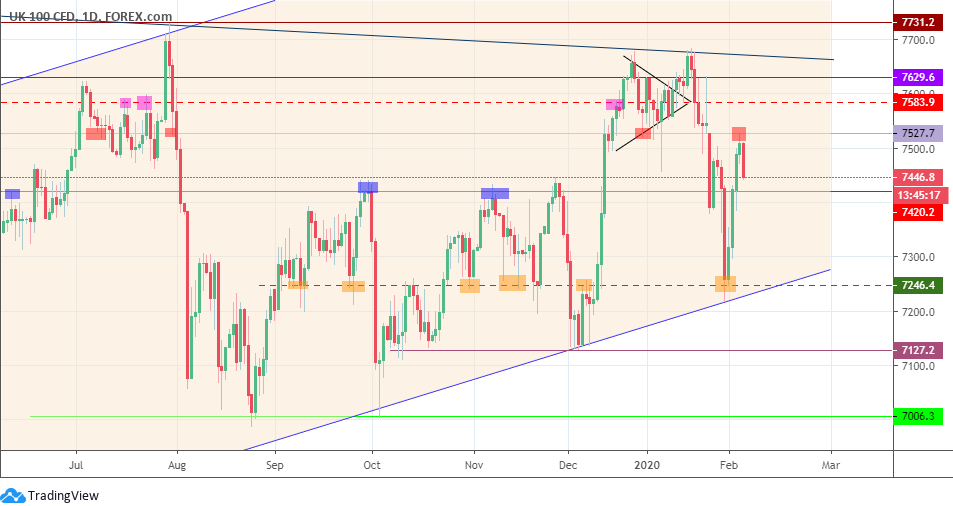
UK 100 Daily Chart: February 7, 2020
A break below 7420.2 targets the 7246.4 support line. This also coincides with the support formed by the lower border of the ascending channel. Further breach of the 7246.4 support leads to a breakdown of the channel, allowing the UK 100 approach the next support level located at 7127.2, where previous lows of 9/10 October 2019 as well as a cluster of lows of the first week of December 2019 are located. The 7006.3 price level (previous lows of 25 August and 3 October 2019) also lurks nearby and could become relevant if the UK 100 breaches the channel to the downside.
On the flip side, a recovery that comes in the form of a possible bounce on 7420.2 could allow the UK 100 to resume the bullish move, which could then retest the 7527.7 resistance. 7581.9 is the next resistance target, and this could come into play if the UK 100 transcends the 7527.7 resistance.
Bulls
Bulls will require the 7527.7 price level to be broken to the upside for the UK 100 to make a possible run towards the cluster of resistance levels located above. This also opens the door towards the ascending channel’s upper border.
Bears
Bears need to see a downside violation of 7420.2 before the price could target the channel’s lower border at 7246.4.
Prices to watch: 7527.7 (bulls) and 7420.2 (bears).