Market action for the UK 100 this week has been dominated by massive “risk-off” trading. Tepid manufacturing PMI data from China triggered the risk-off sentiment, which kicked into full swing when the US ISM Manufacturing PMI data gravely disappointed market expectations. A global sell-off in the stock markets as well as risky commodities followed, while safe haven assets such as the Japanese Yen, gold and the Swiss Franc benefited.
Soft ISM Non-Manufacturing PMI data as well as strengthening of the Pound as a result of new Brexit proposals from the UK Prime Minister combined to hand the UK 100 a steep drop in value on Thursday. The UK 100 index futures was trading 317 points lower from Monday’s open as at the time of writing. The index was down by 432 points for the week at a point, but it recovered some lost ground in late afternoon trading.
The UK 100 ’s top gainers so far include Sage, Diageo, Segro, Unilever and Glaxo SmithKline. ITV and SSE also recorded very modest gains.
Among the top losers was fashion retailer Ted Baker, whose shares plummeted 35.6% after reported a half-year loss of £23m. Imperial Brands shares were also in the green briefly following the resignation of its out-of-favour CEO Alison Cooper, but closed lower by 28p. J Sainsbury and Rolls Royce fell 2.85% and 2.89% on the day. BAT, Kingfisher and the Bentley Group also joined the list of losers in a very rough day for companies on the UK 100 .
Technical Analysis for UK 100
This week’s price action is in keeping with the outlook for the UK 100 as described in last three weeks. On the long-term monthly chart, the 2019 highs are still unchallenged. The last two highs on the chart (May 2018 and July 2019) are lower highs, indicating a stall in the long-term uptrend.
This set the tone for the medium-term outlook, seen on the weekly chart. Here, we see a rising channel within which price activity also formed a rising wedge. The wedge pattern has now been completed by the expected downside move. This occurred in a typical break -> pullback -> resolution fashion, in the expected direction.
Having completed the measured move to the 7051.7 price level, the weekly price candle bounced neatly off the channel’s trendline. Horizontal support is also formed at this area by previous lows of the weeks that ended February 26 and March 5 last year, as well as February 25 2019.
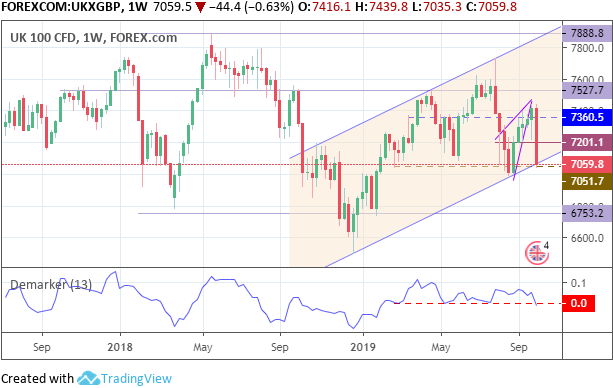
UK 100 Weekly Chart
On stepping down to the daily chart, the breakdown of price action from the rising wedge is seen in clearer terms. The price bounce from the rising channel’s trendline is also visible. The horizontal support at 7051.7 is also seen interacting with the channel’s trendline, strengthening that support area.
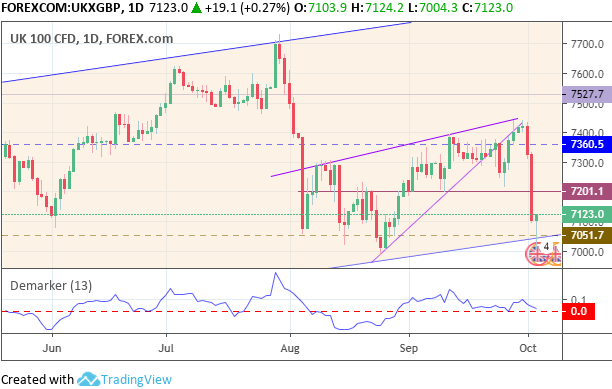
UK 100 Daily Chart
The DeMarker oscillator is yet to break the horizontal trendline at the 0.0 area. It is therefore at a neutral standpoint: neither overbought nor oversold.
Price Action Scenario
The natural price progression in a channel is for price to move from one border to the other until a break occurs. However, the medium-term and near-term views show that many roadblocks exist along the way.
One of these road blocks is the initial resistance to the bounce move at 7201.1 (Aug 21 and 22 highs as well as Sep 2, 9 and 10 lows in role reversal). Above this level lies the previous resistance at 7360.5. There must be a strong close above 7201.1 using price/time filters to bring 7360.5 into focus once more.
However, price may also reattempt the downside break of the rising channel. In this instance, we need to see continued risk-off action in the market, which could result from the October 4 Non-farm Payrolls report or from GBP-positive Brexit headlines. The Q3 earnings season is also not far off and disappointing earnings from the big companies could be the trigger for this break.
A double candle close or a 3% penetration close below the 7051.7 support level (lows of the weeks ended Feb 26 2018 and Feb 25 2019) could complete the break from the up channel, and allow price to aim for the next support at 6753.2 (low of the week ended January 28, 2019). This move is temporarily invalidated by a break above 7201.1.
Bulls
Within the context of the weekly chart, bulls would be looking for a break above 7201.1. This allows for a push to the upper channel border (the return line), if momentum is enough to take the UK 100 above 7360.5 and ultimately 7525.7 (Nov 2017 and April 2019 highs).
Bears
Bears would hope for a rejection of any pullback to 7201.1 which opens the door for another run towards 7051.7 and possibly a break below the channel.
Prices to watch: 7201.7 (bulls) and 7051.7 (bears).