All the Brexit-related action on the political front did not really translate into anything major for the UK 100 this week. Last week’s bullish momentum was not sustained, as bears took over in a week that has seen more selling than buying.
As at the time of writing, the UK 100 futures are trading 67.9 points lower this week. The selloff for the week is led by companies such as NMC Health PLC, which saw 17.31% of its share price wiped off by profit taking. Making up the losers chart also are Kingfisher, which has so far lost 5.65% on its share price, and Royal Bank of Scotland Group which shed 8.56%. Prudential has lost 4.91% this week, while Lloyd’s Banking Group has shed 4.45%. Others are Coca Cola (2.61%), Centrica Plc (2.75%) and BT Group PLC (2.77%).
The UK 100 ’s big gainers for the week have been Fresnillo (8.23%), BAE Systems PLC (7.31%), Intertek Group PLC (7.18%), AVEVA Group PLC (6.68%), Scottish Mortgage Investment Trust (6.67%), Burberry Group (5.64%), GlaxoSmithKline PLC (5.91%), Centrica Plc (5.59), BP (4.45), Sage Group PLC (3.57%) and Standard Chartered PLC which added 3.48%.
Technical Outlook for UK 100
Trade volumes on the UK 100 picked up this week once it became clear that Brexit would get an extension; a situation which the markets accepted in a consolatory fashion as it has reduced the odds of a no-deal Brexit.
The most recent price action on the monthly chart continues to trend upwards, but is caged within the up channel. The monthly candle for the UK 100 has closed lower, which takes it close to the channel’s trendline (lower border).
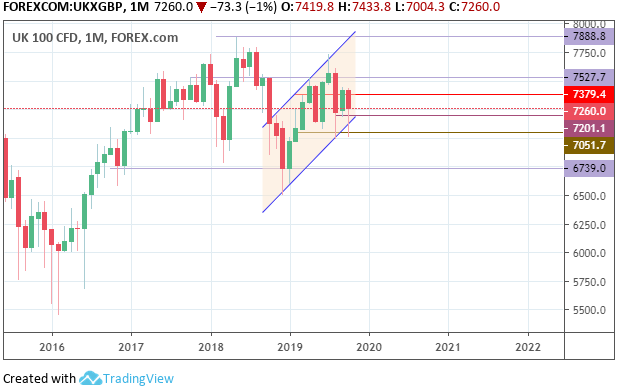
UK 100 Monthly Chart
The initial bearish bias on the UK 100 monthly chart has mostly been counteracted by optimism around Brexit, which has helped push the monthly candle off its lows.
The medium-term outlook is presented on the weekly chart. This chart shows that price has not made much progress beyond the range of last week’s candle. Price continues to trade within the up channel identified on the monthly chart and also within a horizontal range defined by the most recent weekly candles.
The floor of this range intersects the channel’s trendline at 7127.2, while the range ceiling is found at 7420.2. Price is still located somewhere in the centre of this range, and tomorrow’s trading session will determine whether it will move towards the upper or lower barrier of the range.
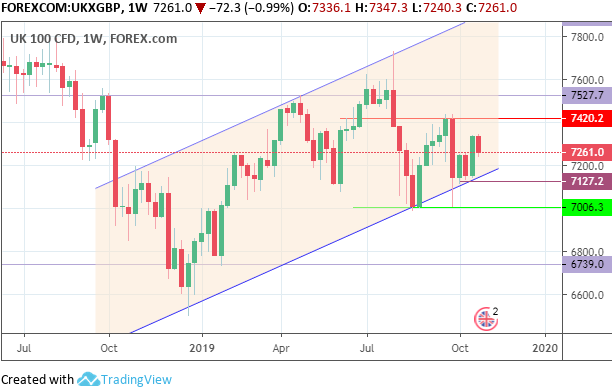
UK 100 Weekly Chart: October 25, 2019
There needs to be a conclusive close of the weekly candle by a 3% penetration to confirm the breakout, which would see price aiming for the horizontal resistance at 7360.5. The weekly candle has effectively pushed through the previous horizontal resistance at 7201.1 (highs of August 22 and October 9). Barring any last minute selloffs, it is safe to say that this level has been broken effectively. This action converts the 7201.1 level into a support as per role reversal.
The daily chart confirms the outlook on the weekly chart. This week’s price action is revealed more clearly, indicating that the UK 100 is well on its way to completing a 5-day winning streak, barring any last-minute selloffs on Friday.
Outlook for UK 100
In terms of price activity for the month of October, the UK 100 continues to trade in the channel band on the monthly chart, but has basically range traded on the weekly and daily charts, pointing towards medium-term and near-term indecision.
Within the context of the up channel on the weekly chart, price action needs to trade above 7420.2 and 7527.7 (highs of the weekly candles of March 18 as well as May 6, 13 and 20) in order to gain access to the channel’s return line (upper border). These two price levels therefore remain the upside targets. A break of 7420.2 therefore targets 7527.7 in the medium-term.
On the flip side, a downside break of 7127.2 will violate both the floor of the range and the channel’s trendline, which sets up a channel breakdown scenario. In that situation, there must be a double candle close or a 3% penetration to the downside to confirm such a break. This then opens the door to the 7006.3 price level (previous lows of the weekly candles of August 19 and August 26).
Bulls
For bulls, the price to watch for is 7240.2, a break of which opens the door for further upside to 7527.7 and beyond.
Bears
Bears would hope for a price dip below 7127.2 which would signal the breakdown of the channel and further downside to 7006.3 and 6739.0.
Prices to watch: 7240.2 (bulls) and 7127.2.5 (bears).