This report is not a personal recommendation and does not take into account your personal circumstances or appetite for risk.
Index Focus - 19 September 2017
Equities are mixed, hovering around break even. This is not unusual as the US Federal Reserve begins its latest two-day monetary policy meeting. After all, investors from all asset classes are preparing to hear – tomorrow evening – more about the unwinding of its QE-bloated balance sheet (imminent?) and the timing of its next rate hike (Dec?).
The UK UK 100 is pushing higher thanks to a weaker GBP and positive contributions from HSBC (Asian calm), RDSb & BP (higher oil price), BLT (copper resilience, higher oil) and IAG (peers benefiting from RYA woes, GS sector update). This is offsetting a drag from BATS (new US regs, defensives being shunned) and BT (profit taking, defensives being shunned).
The German DAX is in the red as gains for Deutsche Lufthansa (RYA woes, GS sector update), Deutsche Post, Deutsche Boerse (end of CEO probe in sight?) and Fresenius Medical are undone by weakness for RWE (Exane downgrade), Adidas (strong EUR) and Linde (Norway supports merger with Praxair).
The UK Index 100 has extended its bounce to test Friday’s breakdown at 7280. The DAX 30 remains around the 12530 floor of a shallow rising channel. Dow Jones Futures have plateaued around 22350, with some bearish signals. Gold has found support at $1305 but could be forming a bearish flag lower.
Click below to expand sections for more detailed analysis
Where next?
- Will the index fall towards lows of 7,195? or;
- Will the index rise towards highs of 7,550?
The UK Index 100 has extended its bounce to test Friday’s breakdown at 7280. Note RSI falling highs
- Watch levels: Bullish 7,295, Bearish 7,265
Solid Green line
Possible support
Solid Red line
Possible resistance
- Trend: Uptrend
- Potential support: 7265, 7240, 7230, 7220, 7200, 7195
- Potential resistance: 7280, 7295, 7300, 7310, 7320, 7340, 7360, 7400
Important: The information provided above does not constitute advice or opinion and must only be regarded as technical observations.
Click here for help with Support & Resistance Click here for help with technicals
Where next?
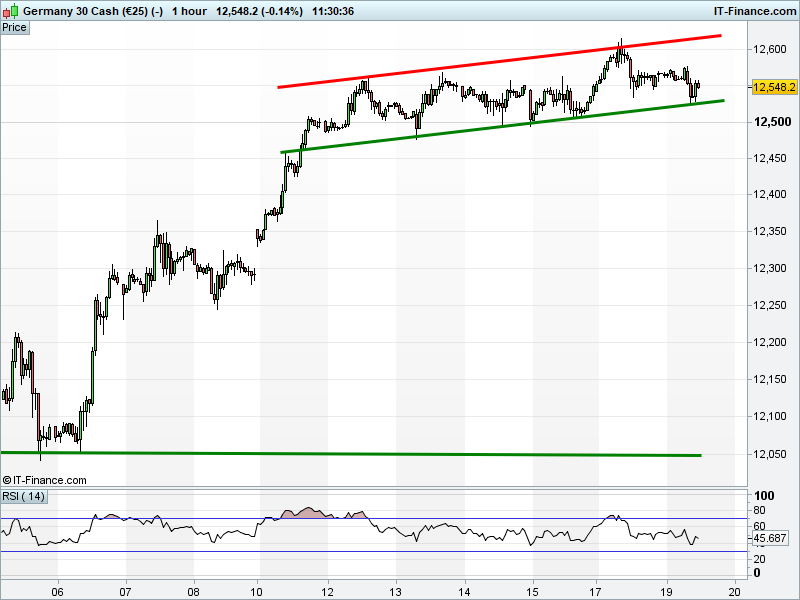
- Will the index fall towards lows of 12,050? or;
- Will the index rise towards highs of 12,615?
The DAX 30 remains around the 12530 floor of a shallow rising channel
- Watch levels: Bullish 12,560, Bearish 12,530
Solid Green line
Possible support
Solid Red line
Possible resistance
- Trend: Uptrend
- Potential support: 12540, 12530, 12510, 12500, 12475, 12400
- Potential resistance: 12560, 12575, 12600, 12615, 12675
Important: The information provided above does not constitute advice or opinion and must only be regarded as technical observations.
Click here for help with Support & Resistance Click here for help with technicals
Where next?
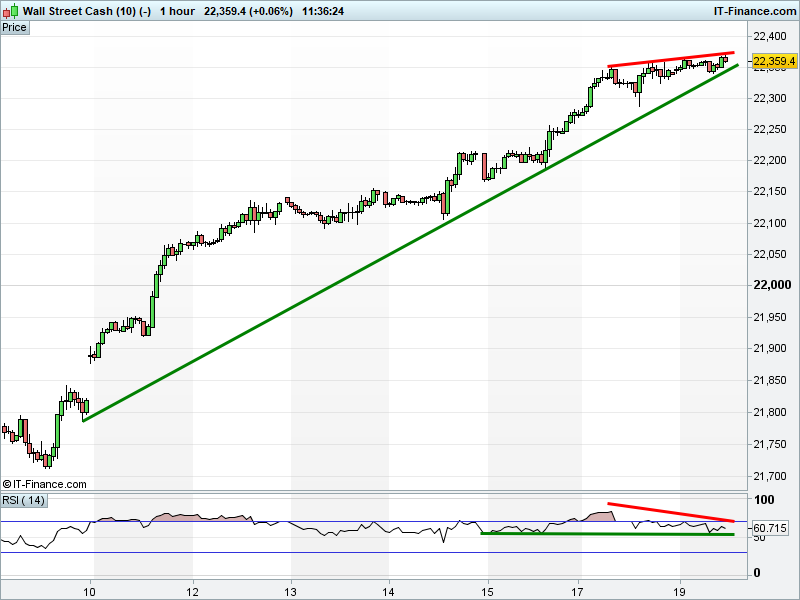
- Will the index fall towards lows of 21,700? or;
- Will the index rise above highs of 22,368
Dow Jones Futures have plateaued around 22350. Bearish rising wedge? RSI holding above 50 = bullish , but also displaying negative divergence with price
- Watch levels: Bullish 22,370; Bearish 22,340
Solid Green line
Possible support
Solid Red line
Possible resistance
- Trend: Sideways
- Potential support: 22350, 22340, 22320, 22300, 22285, 22260, 22220, 22185
- Potential resistance: 22368, -
Important: The information provided above does not constitute advice or opinion and must only be regarded as technical observations.
Click here for help with Support & Resistance Click here for help with technicals
Where next?
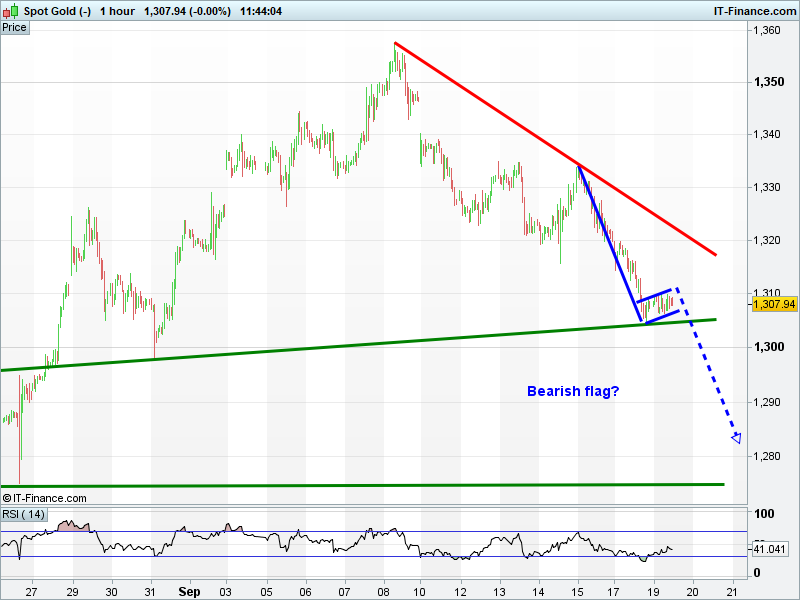
- Will Gold fall towards lows of $1,275? or;
- Will Gold rise towards highs of $1,358?
Gold has found support at $1305 but could be forming a bearish flag lower.
- Watch levels: Bullish $1310, Bearish $1305
Solid Green line
Possible support
Solid Red line
Possible resistance
- Trend: Downtrend
- Potential support: 1305, 1300, 1298, 1295, 12290, 1280, 1275
- Potential resistance: 1310, 1315, 1320, 1335, 1340, 1355
Important: The information provided above does not constitute advice or opinion and must only be regarded as technical observations.
Click here for help with Support & Resistance Click here for help with technicals
Back to Top
This research is produced by Accendo Markets Limited.
Research produced and disseminated by Accendo Markets is classified as non-independent research,
and is therefore a marketing communication. This investment research has not been prepared in accordance
with legal requirements designed to promote its independence and it is not subject to the prohibition on
dealing ahead of the dissemination of investment research. This research does not constitute a personal
recommendation or offer to enter into a transaction or an investment, and is produced and distributed for information purposes only.
Accendo Markets considers opinions and information contained within the research to be valid when published,
and gives no warranty as to the investments referred to in this material. The income from the investments referred to may go down as well as up,
and investors may realise losses on investments. The past performance of a particular investment is not necessarily a guide to its future performance.
Prepared by Michael van Dulken, Head of Research