This report is not a personal recommendation and does not take into account your personal circumstances or appetite for risk.
Index Focus - 18 January 2018
Equities are mixed around break-even as investors weigh up the first acceleration in China GDP since 2010, solid Industrial Production growth but poor Retail Sales. A mixed picture begs questions about, 1) Chinese data, and, 2) measures in place to carefully deflate a credit bubble.
The UK Index underperforms, but Miners and Energy are positive, shrugging off GBP strength, suggesting appetite for risk over defensives, as commodity prices are buoyed by corresponding USD weakness (US government shutdown looming). Data and corporate results remain in the driving seat driving ahead of month-end central bank updates (ECB/Fed).
The UK UK Index underperforms, dragged lower by HSBC (profit taking, Carillion exposure), ABF (results), SHP (broker preference for Roche), a plethora of defensives (GBP strength, preference for risk) and a handful of ex-dividends. Limited help from Miners (metals up on USD weakness), Energy (Oil prices stable) and HL.
Germany’s DAX if just offside, with losses for Utilities (hawkish ECB, exposed to higher rates) offsetting outsized gains for Tech, Autos and Insurance.
The UK Index 100 has broken below 7715. The DAX 30 remains in 13140-13345 range. Dow Jones Futures continue to push for fresh highs above 26150. Gold is off its lows, nearing a test of yesterday’s $1332 breakdown.
Click below to expand sections for more detailed analysis
Where next?
- Will the index fall towards lows of 7,580? or;
- Will the index rise towards fresh highs of 7,810?
The UK Index 100 has broken below 7715 to extends its correction.
- Watch levels: Bullish 7,720, Bearish 7,688
Solid Green line
Possible support
Solid Red line
Possible resistance
- Trend: Downtrebd
- Potential support: 7688, 7668, 7362, 7580
- Potential resistance: 7715, 7740, 7750, 7765, 7785, 7805, -
Important: The information provided above does not constitute advice or opinion and must only be regarded as technical observations.
Click here for help with Support & Resistance Click here for help with technicals
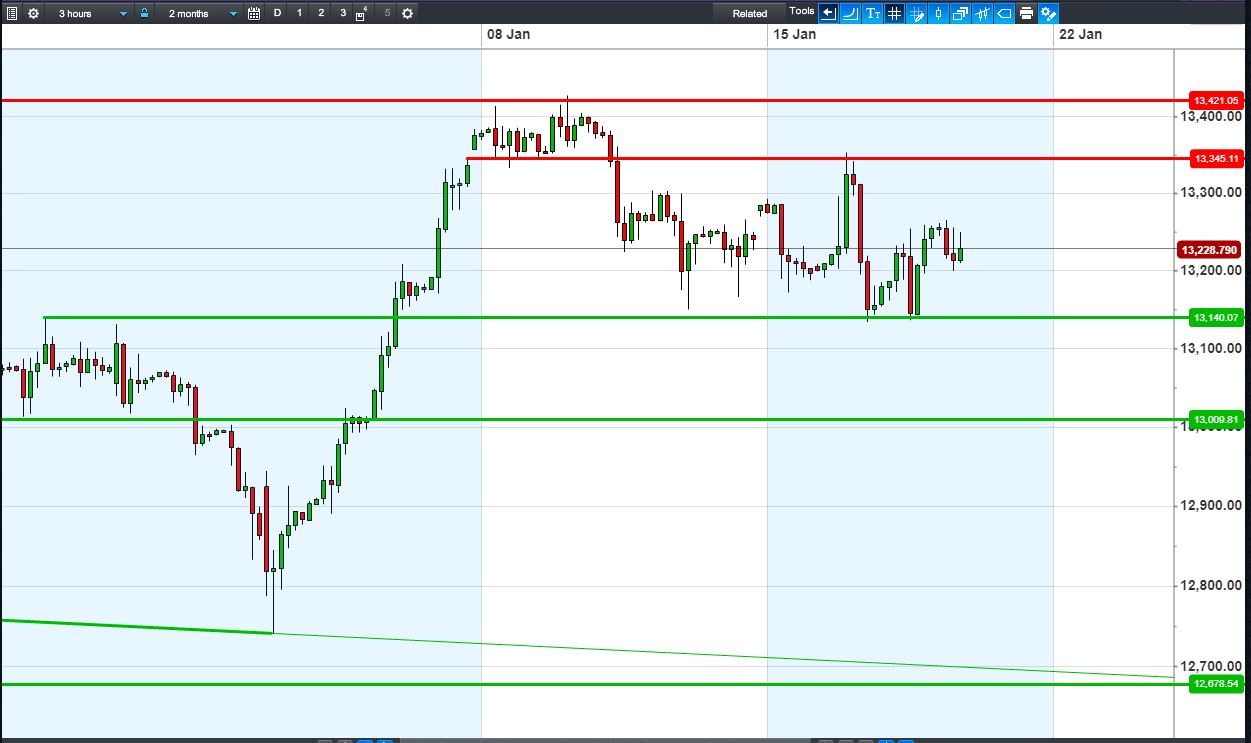
Where next?
- Will the index fall towards lows of 12,700 or;
- Will the index rise towards highs of 13,421?
The DAX 30 remains in 13140-13345 range. Which way will it break?
- Watch levels: Bullish 13265; Bearish 13200
Solid Green line
Possible support
Solid Red line
Possible resistance
- Trend: Sideways
- Potential support: 13200, 13140, 13100, 13010
- Potential resistance: 13265, 13300, 13345, 13421
Important: The information provided above does not constitute advice or opinion and must only be regarded as technical observations.
Click here for help with Support & Resistance Click here for help with technicals
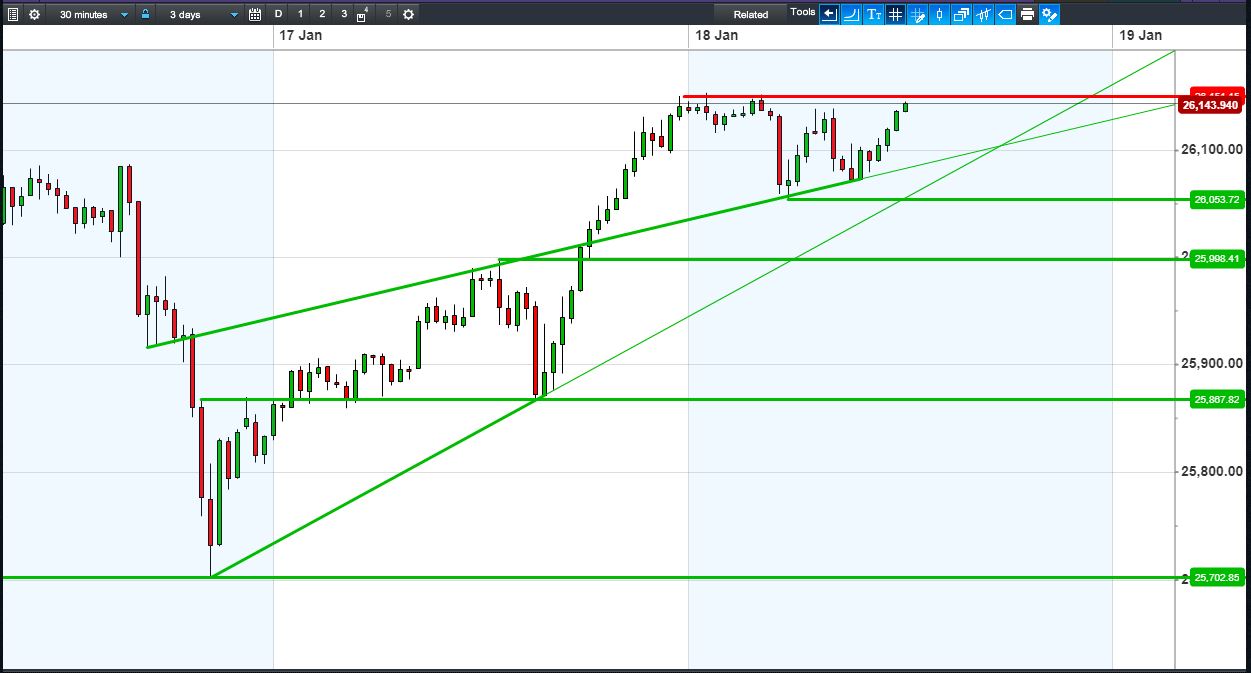
Where next?
- Will the index fall towards lows of 25,700? or;
- Will the index rise towards new highs of 26,200?
Dow Jones Futures continue to push for fresh highs above 26150 to extend its relentless move north since Trump was elected.
- Watch levels: Bullish 26,155 Bearish 26,050
Solid Green line
Possible support
Solid Red line
Possible resistance
- Trend: Uptrend
- Potential support: 26100, 26050, 26000, 25871
- Potential resistance: 26150, 26200, -
Important: The information provided above does not constitute advice or opinion and must only be regarded as technical observations.
Click here for help with Support & Resistance Click here for help with technicals
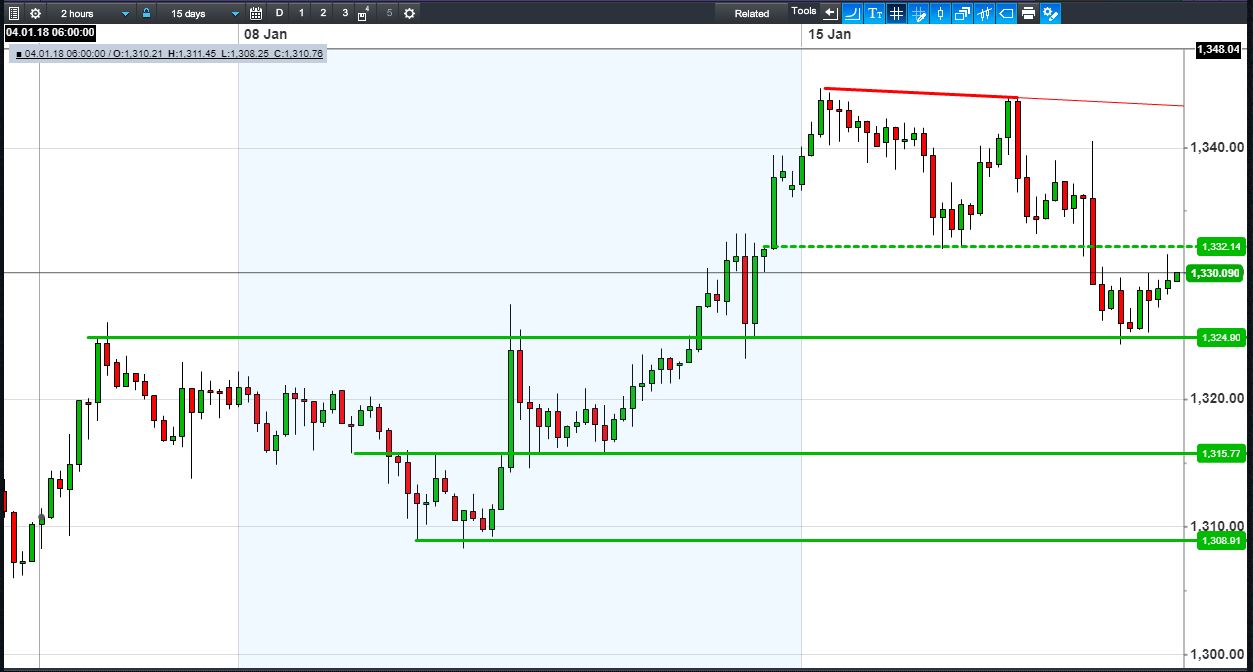
Where next?
- Will Gold fall towards lows of $1,309? or;
- Will Gold rise towards highs of $1,345?
Gold’s is off its lows, nearing a test of yesterday’s $1332 breakdown.
- Watch levels: Bullish $1332, Bearish $1325
Solid Green line
Possible support
Solid Red line
Possible resistance
- Trend: Sideways
- Potential support: 1325, 1320, 1316, 1309
- Potential resistance: 1332, 1336, 1340, 1343, 1345
Important: The information provided above does not constitute advice or opinion and must only be regarded as technical observations.
Click here for help with Support & Resistance Click here for help with technicals
Back to Top
This research is produced by Accendo Markets Limited.
Research produced and disseminated by Accendo Markets is classified as non-independent research,
and is therefore a marketing communication. This investment research has not been prepared in accordance
with legal requirements designed to promote its independence and it is not subject to the prohibition on
dealing ahead of the dissemination of investment research. This research does not constitute a personal
recommendation or offer to enter into a transaction or an investment, and is produced and distributed for information purposes only.
Accendo Markets considers opinions and information contained within the research to be valid when published,
and gives no warranty as to the investments referred to in this material. The income from the investments referred to may go down as well as up,
and investors may realise losses on investments. The past performance of a particular investment is not necessarily a guide to its future performance.
Prepared by Michael van Dulken, Head of Research