This report is not a personal recommendation and does not take into account your personal circumstances or appetite for risk.
Index Focus - 15 September 2017
The UK UK 100 looks set to buck the trend for equities, closing the week on a downer after breaching summer support at 7300 to revisit 4.5-month lows at 7200. The driver is the supposedly dovish BoE member Vlieghe talking up the chance of an imminent UK rate rise . This has added to yesterday’s GBP rally following a hawkish BoE policy update, sending Sterling to post-referendum highs vs USD and near 2-month highs vs EUR. Already under the cosh yesterday, this morning’s GBP extension is weighing even more heavily on the UK Index ‘s many internationally exposed names.
The UK UK 100 is back at 7200, the stronger GBP reducing the value of international profits and/or dividends (Oil majors, Consumer Staples, Tobacco, BATS, Pharma, Miners). This is offsetting very limited help from NXT (enjoying yesterday’s results), easyJet (long-haul pact), MRW (steady after yesterday’s drop).
The German DAX is only just offside, helped by a weaker EUR (vs GBP), with the only notable movers being utility RWE, down sharply after a broker downgrade and Deutsche Boerse up on hope of an end to CEO insider dealing probe.
The UK Index 100 has found support at 7200 4.5 month lows. The DAX 30 sits 12500-12560, potentially consolidating via another bullish flag before another up-leg. Dow Jones Futures trade fresh all-time highs 22200. Gold trades a narrow range around $1325, with neither risk appetite or aversion to excite.
Click below to expand sections for more detailed analysis
Where next?
- Will the index fall towards lows of 7,085? or;
- Will the index rise towards highs of 7,600?
The UK Index 100 has found support at 7200 4.5 month lows. Bounce or further to fall?
- Watch levels: Bullish 7,215, Bearish 7,190
Solid Green line
Possible support
Solid Red line
Possible resistance
- Trend: Downtrend
- Potential support: 7200, 7195, 7185, 7150, 7100, 7085
- Potential resistance: 7210, 7220, 7235, 7250, 7265, 7280, 7295
Important: The information provided above does not constitute advice or opinion and must only be regarded as technical observations.
Click here for help with Support & Resistance Click here for help with technicals
Where next?
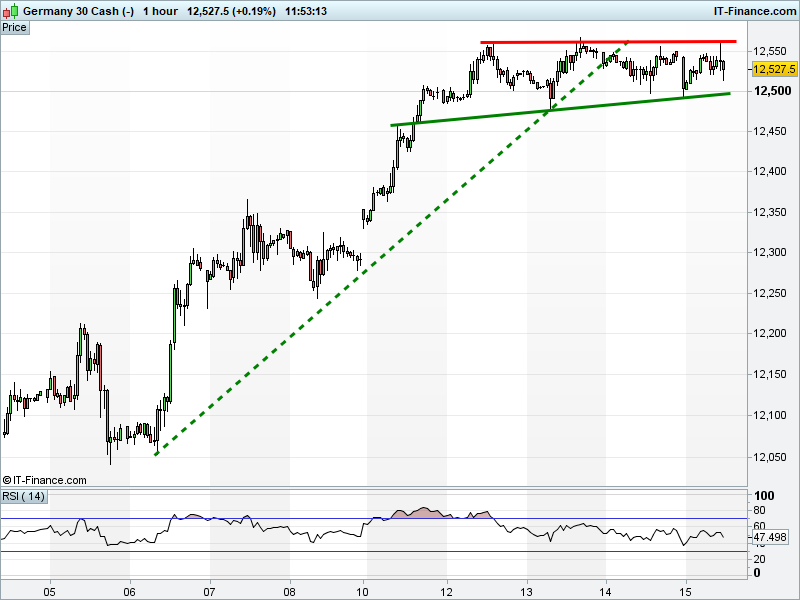
- Will the index fall towards lows of 11,865? or;
- Will the index rise towards highs of 12,900?
The DAX 30 sits 12500-12560, potentially consolidating via another bullish flag before another up-leg
- Watch levels: Bullish 12,560, Bearish 12,500
Solid Green line
Possible support
Solid Red line
Possible resistance
- Trend: Uptrend
- Potential support: 12515, 12500, 12475, 12460, 12450, 12425, 12400, 12365
- Potential resistance: 12560, 12570, 12580, 12600, 12655, 12675
Important: The information provided above does not constitute advice or opinion and must only be regarded as technical observations.
Click here for help with Support & Resistance Click here for help with technicals
Where next?
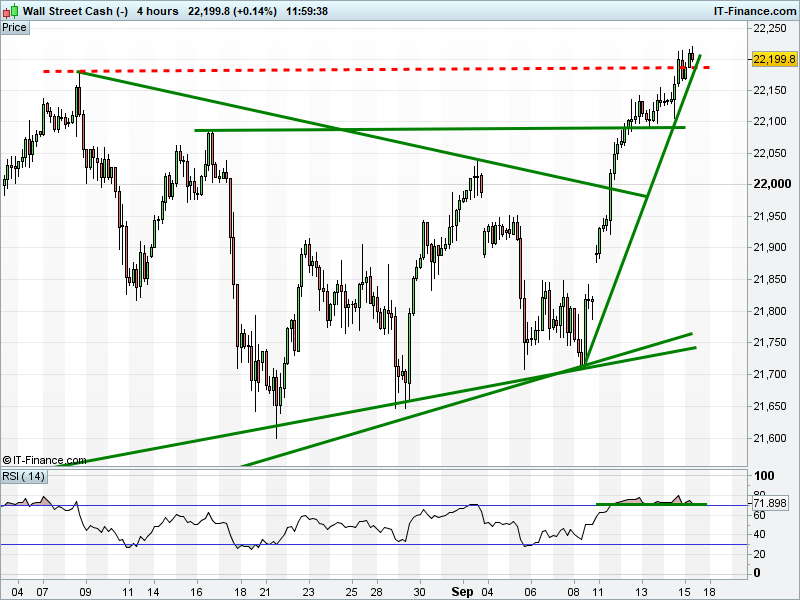
- Will the index fall towards lows of 21,600? or;
- Will the index rise above highs of 22,220
Dow Jones Futures trade fresh all-time highs 22,200. RSI bullish.
- Watch levels: Bullish 22,230; Bearish 22,185
Solid Green line
Possible support
Solid Red line
Possible resistance
- Trend: Uptrend
- Potential support: 22200, 22180, 22165, 22150, 22125, 22105
- Potential resistance: 22220, -
Important: The information provided above does not constitute advice or opinion and must only be regarded as technical observations.
Click here for help with Support & Resistance Click here for help with technicals
Where next?
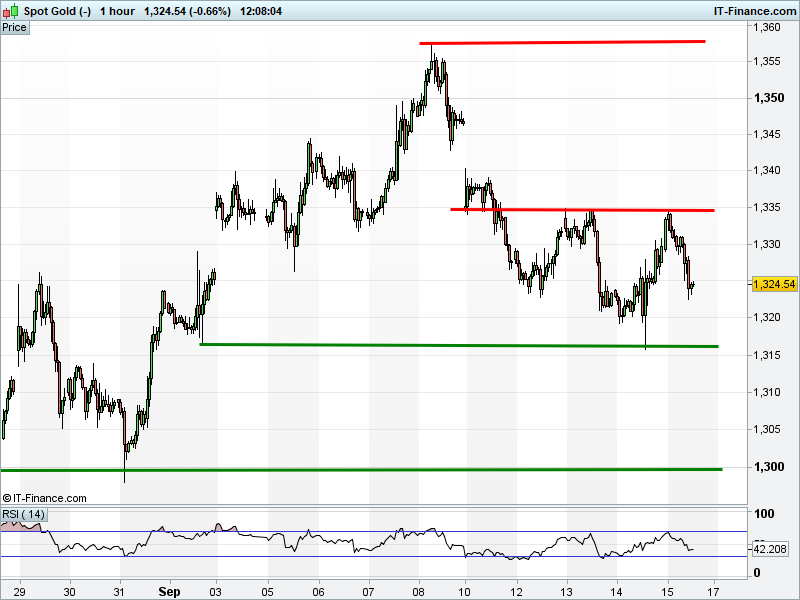
- Will Gold fall towards lows of $1,275? or;
- Will Gold rise towards highs of $1,358?
Gold trades a narrow range around $1325, pondering both risk appetite (bull market) and aversion (North Korea), whilst evaluating hawkish central bank rhetoric.
- Watch levels: Bullish $1326, Bearish $1322
Solid Green line
Possible support
Solid Red line
Possible resistance
- Trend: Sideways
- Potential support: 1322, 1320, 1316, 1310, 1305, 1300, 1290, 1280
- Potential resistance: 1325, 1330, 1335, 1340, 1350, 1355
Important: The information provided above does not constitute advice or opinion and must only be regarded as technical observations.
Click here for help with Support & Resistance Click here for help with technicals
Back to Top
This research is produced by Accendo Markets Limited.
Research produced and disseminated by Accendo Markets is classified as non-independent research,
and is therefore a marketing communication. This investment research has not been prepared in accordance
with legal requirements designed to promote its independence and it is not subject to the prohibition on
dealing ahead of the dissemination of investment research. This research does not constitute a personal
recommendation or offer to enter into a transaction or an investment, and is produced and distributed for information purposes only.
Accendo Markets considers opinions and information contained within the research to be valid when published,
and gives no warranty as to the investments referred to in this material. The income from the investments referred to may go down as well as up,
and investors may realise losses on investments. The past performance of a particular investment is not necessarily a guide to its future performance.
Prepared by Michael van Dulken, Head of Research