This report is not a personal recommendation and does not take into account your personal circumstances or appetite for risk.
UK 100 Index Focus – 31 Oct
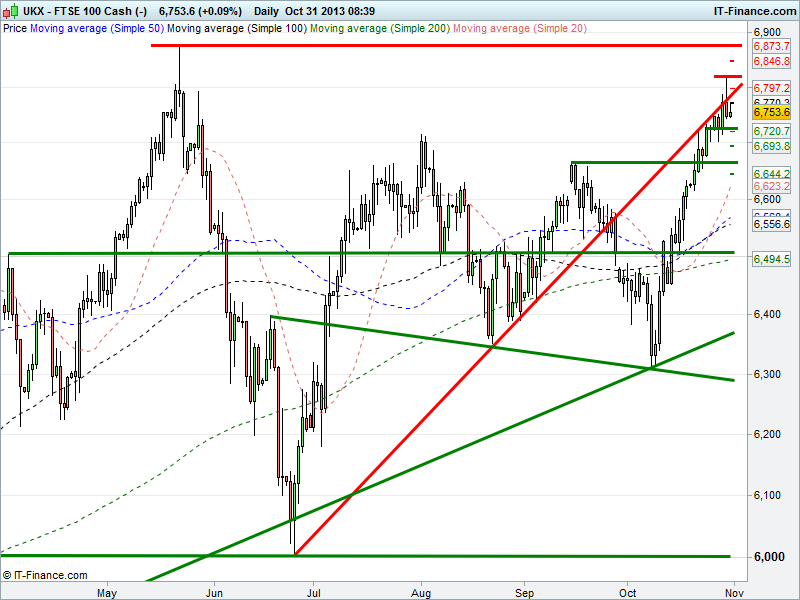
Major Support & Resistance (pivot points – explained):
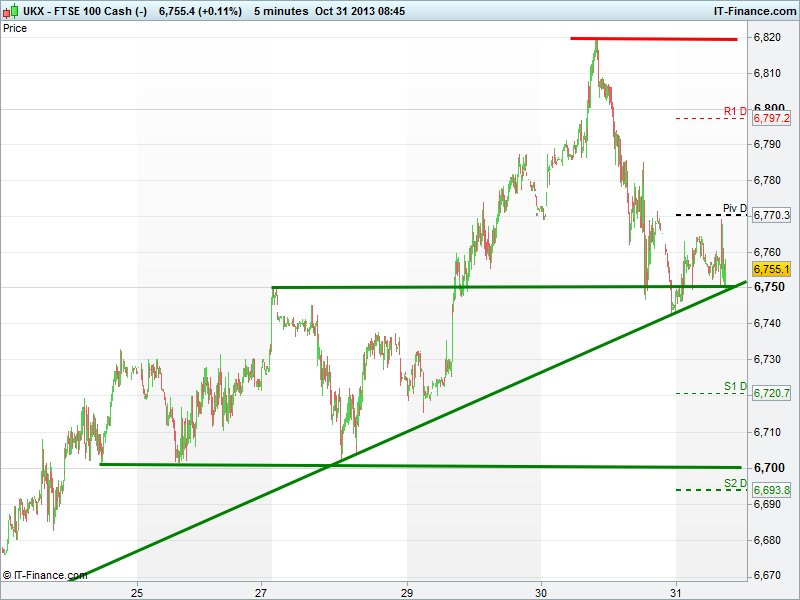
Pivot Point: 6770; Support 1, 2 & 3: 6721, 6694, 6644; Resistance 1, 2 & 3: 6797, 6847, 6874
The FOMC statement delivered what we expected it terms of a less dovish message than markets had hoped for, accomplishing what it likely wanted in terms of taking the top off over-extension in equity markets. This was done by saying tapering still data-dependent and possible in Dec/Jan, well before market expectations of March, despite the fallout from the government shutdown.
The Fed may not really believe in December, but it’s more about managing expectations and preventing market complacency in QE3 easy money policy ad infinitum (or for a good while longer at least) creating a dangerous bubble which could burst and do more damage and require more help to repair. We don’t want to go their again. So sorry guys, the US data-watching remains in force.
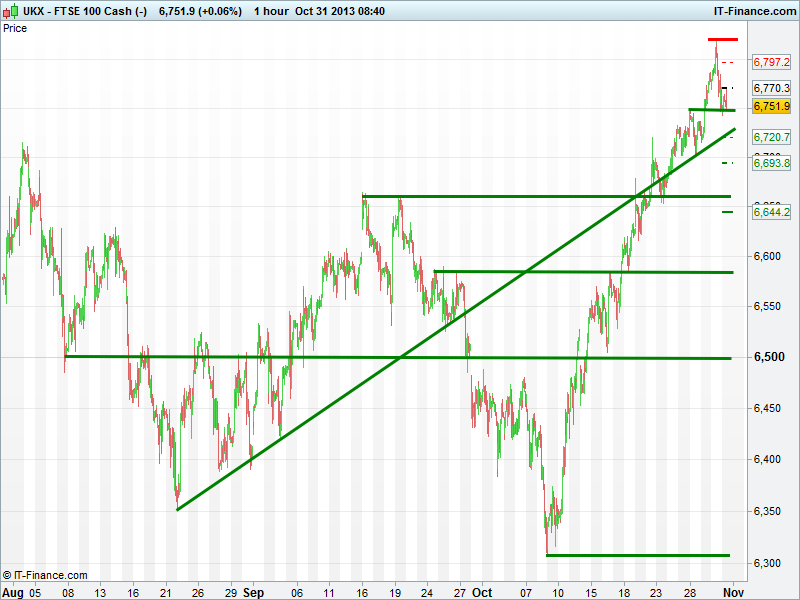
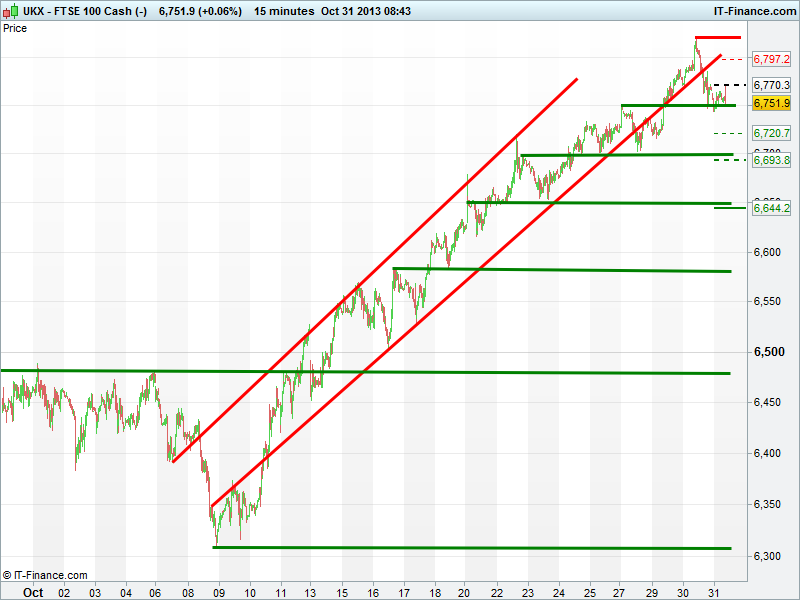
UK 100 back from its foray above 6800 (8.1% rally from Oct lows), but found support at 6750 which coincides with Tuesday’s breakout, Wednesday’s support and a rising support trendline from 21 Oct. Another rising support trendline (intersecting) also sits at 6730 should weakness persist. We still see a correction as healthy and a pull back to major support at 6660 wouldn’t be disastrous before a resumption/renewed attempt at May highs 6875 and possible even all-time highs 6950. Are we set for another Santa Rally to get us there by Christmas?
Solid Green line
Possible support
Solid Red line
Possible resistance
- Trend: Uptrend to sideways
- Potential support: 6720, 6660, 6505, 6400, 6275, 6000
- Potential resistance: 6785, 6820, 6875
Important: The information provided above does not constitute advice or opinion and must only be regarded as technical observations.
Click here for help with Support & Resistance Click here for help with technicals
Back to Top
This research is produced by Accendo Markets Limited.
Research produced and disseminated by Accendo Markets is classified as non-independent research,
and is therefore a marketing communication. This investment research has not been prepared in accordance
with legal requirements designed to promote its independence and it is not subject to the prohibition on
dealing ahead of the dissemination of investment research. This research does not constitute a personal
recommendation or offer to enter into a transaction or an investment, and is produced and distributed for information purposes only.
Accendo Markets considers opinions and information contained within the research to be valid when published,
and gives no warranty as to the investments referred to in this material. The income from the investments referred to may go down as well as up,
and investors may realise losses on investments. The past performance of a particular investment is not necessarily a guide to its future performance.
Prepared by Michael van Dulken, Head of Research