This report is not a personal recommendation and does not take into account your personal circumstances or appetite for risk.
UK 100 Index Focus – 27 Jan
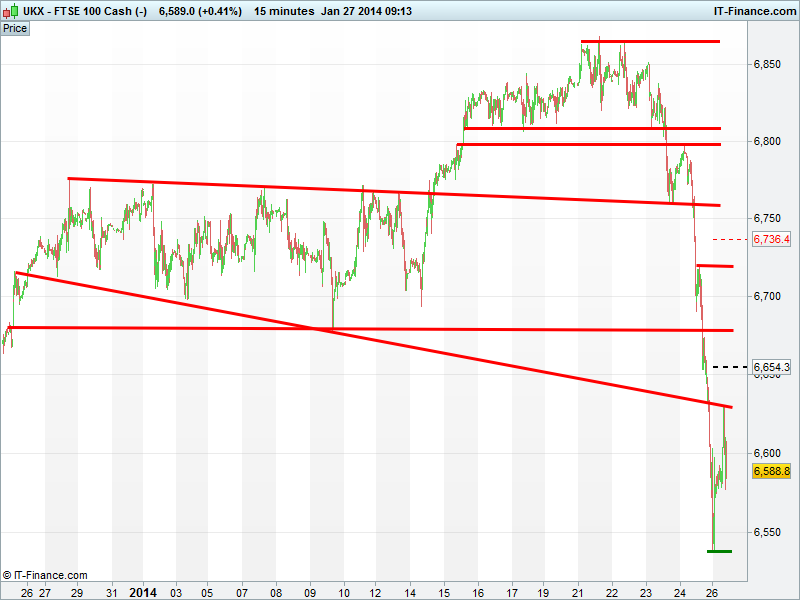
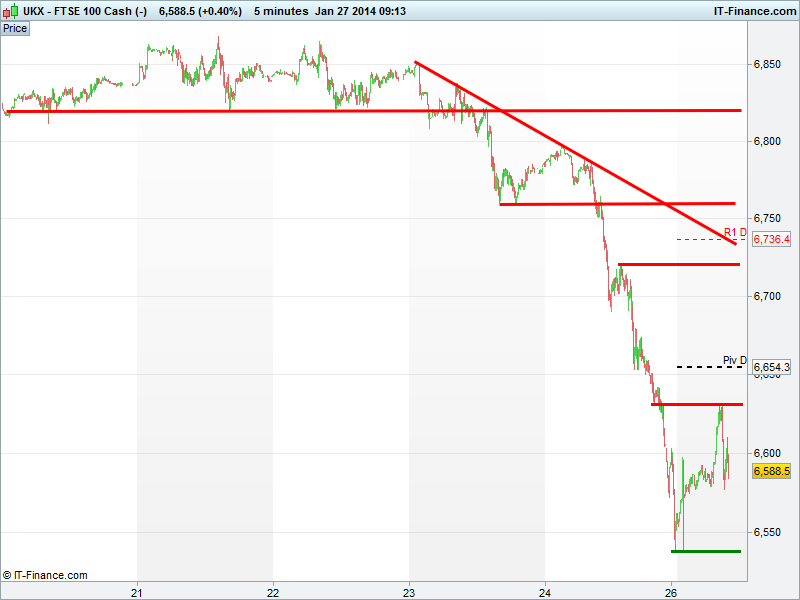
Major Support & Resistance (pivot points – explained):
Pivot Point: 6654; Support 1, 2 & 3: 6512, 6429, 6287; Resistance 1, 2 & 3: 6736, 6879, 6961
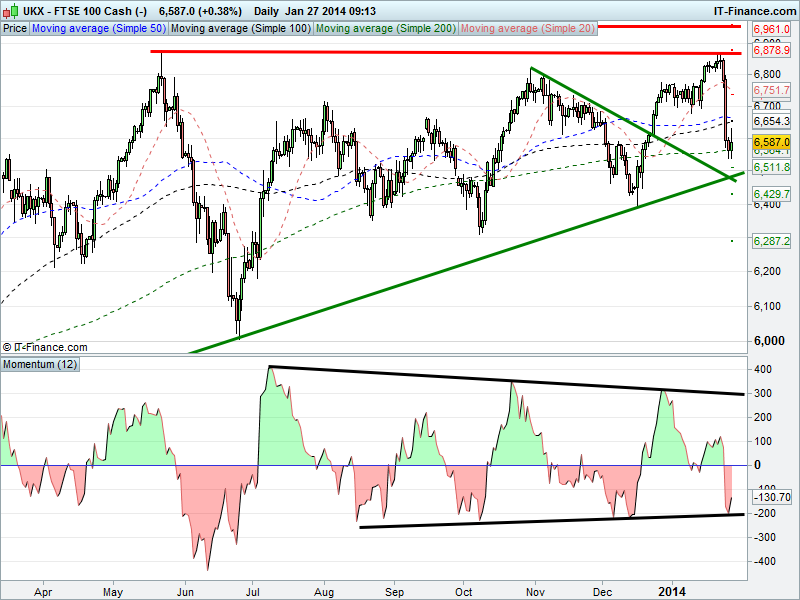
Friday’s sell-off and capitulation on the bubbling over of concerns ranging from China/global growth recovery, emerging FX devaluation, the effects of QE3 tapering on emerging markets and political unrest has seen the UK flagship equity index retrace 5% from its 6865 highs to before finding support at the 6535 level of 15-19 Dec, undoing much but not all of the December rally from 6395.
Of note is the index finding support before 6500 which is where we find rising support from the crisis lows of Mar-09. With the fall back below 6600 since the open, does the index need to fall back there before resuming its uptrend? Secondly, we spy that he index found support around its 200-day moving average of 6556, although this has not proved too helpful for quite a while.
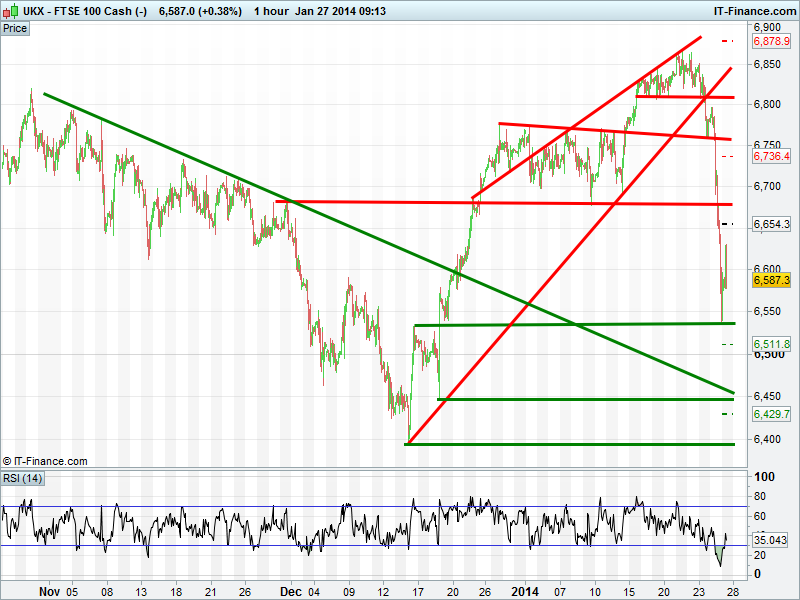
Daily momentum has found support at 6-month rising lows which could be a positive in terms of recovery, and the 3-month hourly Relative Strength Indicator (RSI) has recovered from its most extreme oversold albeit with falling highs. Note pivot points have widened significantly due to recent volatility.
With global growth fears, note earth moving equipment name Caterpillar reporting Q4 results which have potential to influence sentiment on China. Could this calm things or make ’em worse?
Click below to view graphs
Back to Top
This research is produced by Accendo Markets Limited.
Research produced and disseminated by Accendo Markets is classified as non-independent research,
and is therefore a marketing communication. This investment research has not been prepared in accordance
with legal requirements designed to promote its independence and it is not subject to the prohibition on
dealing ahead of the dissemination of investment research. This research does not constitute a personal
recommendation or offer to enter into a transaction or an investment, and is produced and distributed for information purposes only.
Accendo Markets considers opinions and information contained within the research to be valid when published,
and gives no warranty as to the investments referred to in this material. The income from the investments referred to may go down as well as up,
and investors may realise losses on investments. The past performance of a particular investment is not necessarily a guide to its future performance.
Prepared by Michael van Dulken, Head of Research