Over the last few weeks I have written about Banks, Ranges and Results. All three have been popular topics for trading clients. So how about a write-up combing all three. The UK Index Banks have begun to report their results for the first quarter of 2019, and, low and behold, several of them are trading within ranges. A triple trading whammy!
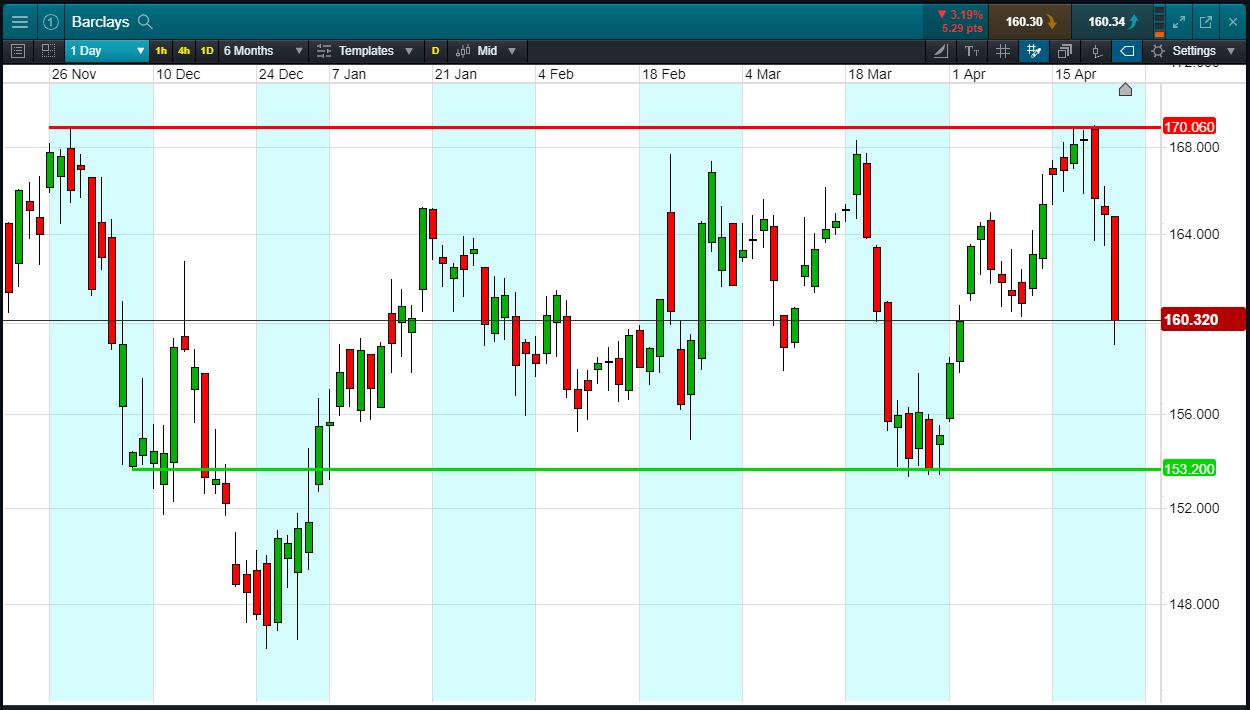
Barclays kicked things off this morning. And the numbers weren’t as well-received as CEO Jes Staley would have liked. Revenues, profits and profitability fell more than expected. Echoing US peers, the more profitable investment banking unit also had a tough quarter. Furthermore, at a group level (including the retail bank), some metrics related to Capital and Returns failed to inspire. This may provide more ammo for activist investors to fight for a say in the boardroom.
 As the most investment banking-exposed of the UK Index Banks, competitors may be more insulated. That said, at home, the UK has its own woes for Retail and Commercial activities (read Brexit). So keep your eyes and ears open for when peers publish: RBS Friday 26 Apr, Standard Chartered Tuesday 30 Apr, Lloyds Thursday 2 May and HSBC Friday 3 May. Previews so far warn of margin pressure from a competitive mortgage market, still low interest rates. Oh, and RBS’ CEO resigned today after 5-6 years, so succession will be in focus tomorrow.
But what I really wanted to write about was Ranges. Results are interesting; real trades are so much more exciting.
 Barclays (160p; see above) has traded back from the ceiling of a 4-month 155-170p range. Whilst the opportunity to capitalise on 9% downside may have passed (we’re two thirds of the way through the fall already), we are monitoring the shares for signs of support around 155p in order to re-highlight to clients the possibility of another 9-10% bounce in the range.
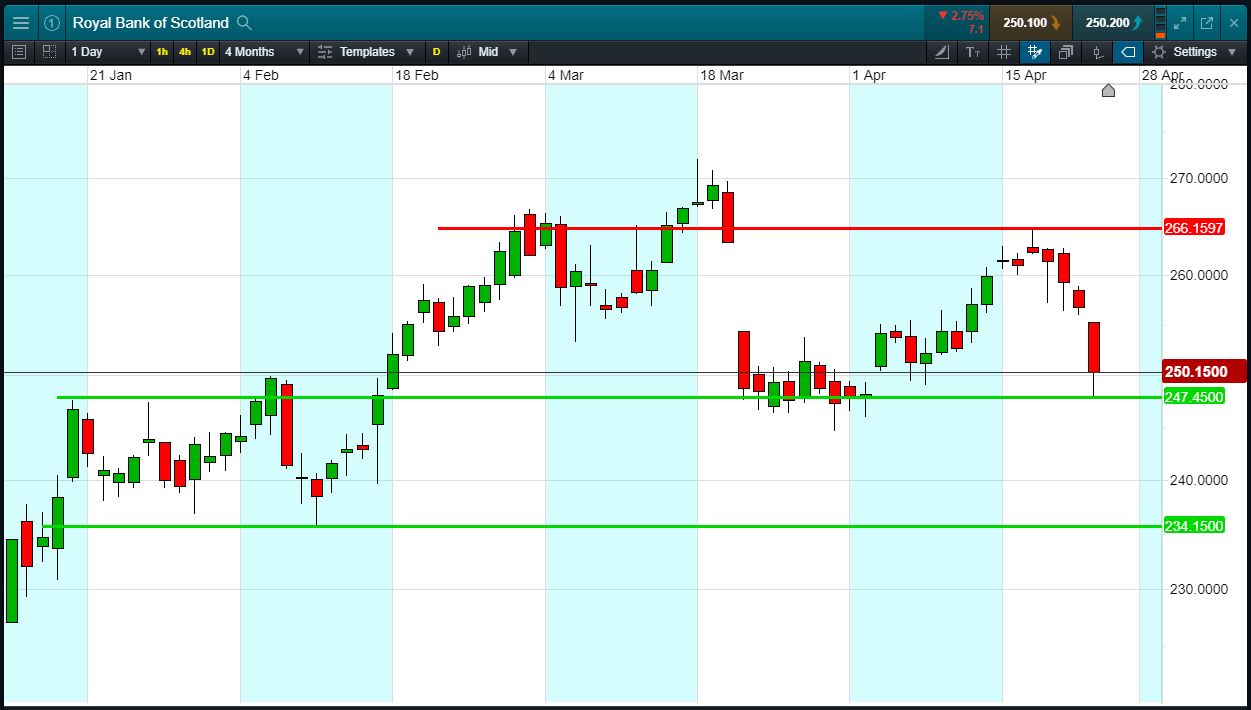
Similarly, RBS (249p; see right) has dropped back from 266p, pretty much completing a 7.5% pull-back from last week’s highs, in a far-from-perfect 246-265p 2-month range. Today’s CEO resignation – he who helped the bank restructure so much – helped nicely.
 Elsewhere, Lloyds (63.5p; see left) is already more than half way through a pullback from 66p to 62p, within a 6-week range. As with Barclays, all eyes on any signs of support at the floor.
Lastly, H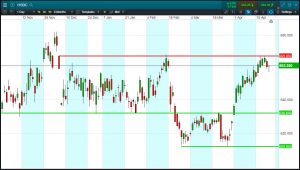 SBC (660p; see right) has seen its shares checked by prior highs, potentially in the early stages of a correction following a 10% rally 610-670p. Whilst it may not fall all the way back to 610p (intersecting support possible at 630p) this still offers a 6% ‘dropportunity’ which may have only just begun. Or will it buck the sector trend of ranges?
My point here, and one I probably mention rather often, is that results season is important, but it’s not like shares do nothing between quarterly updates. Shares trade up and down, sideways, perhaps bouncing within ranges or breaking out with momentum. Results makes up just 4-8 days of the 250 available trading days a year.
 Whether you trade the UK Banks or anything else on the , and you want to receive twice-daily alerts comprising hand-picked trading opportunities, get access to our research Gold Pass now!
Think ranges (horizontal, rising, falling), candidates for a rebound (or a sell-off), shares on a breakout (or breakdown), those displaying signs of momentum (positive or negative) and names reporting results or paying dividends.
We cover it all. Every day. All part of the service. So you have more time to do the finer things in life.
Mike van Dulken, Head of Research, 25 April 2019