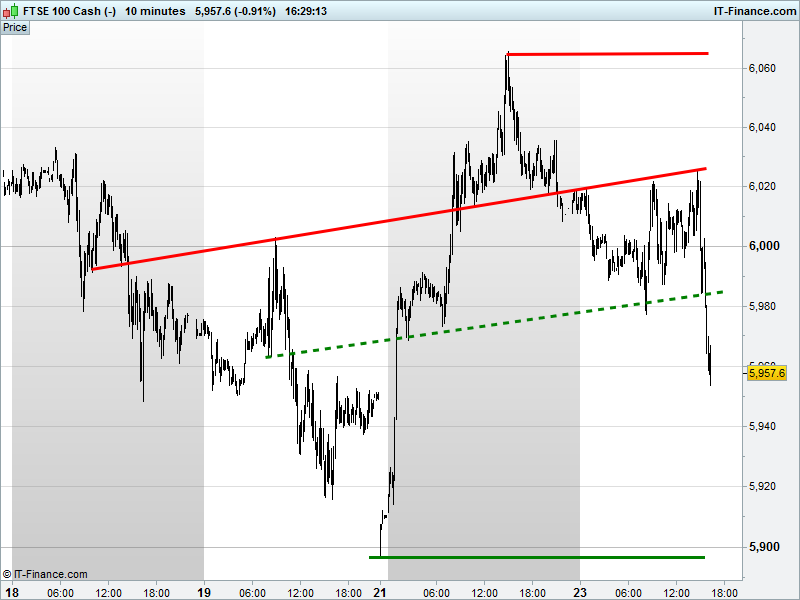
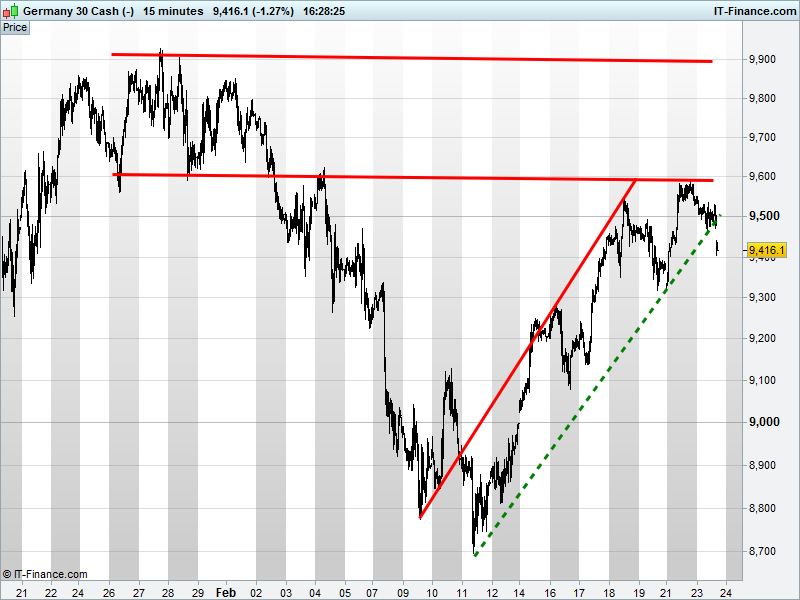
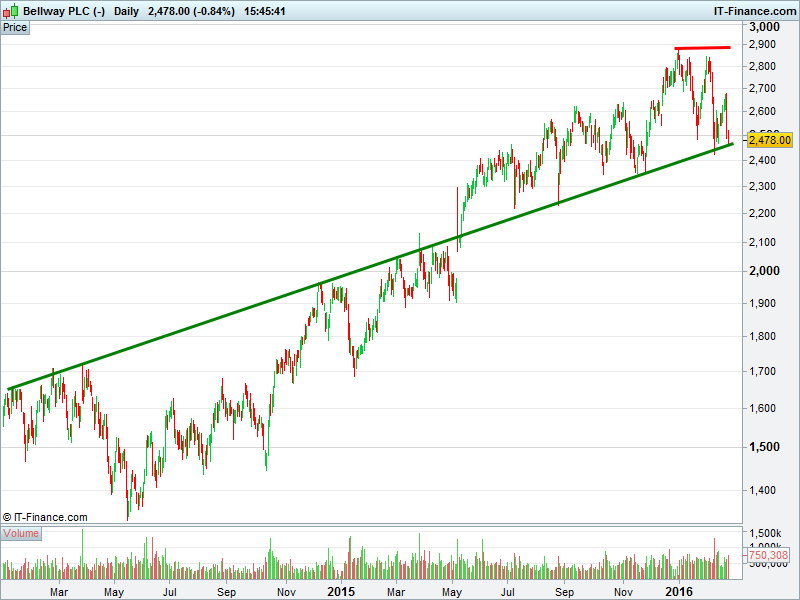
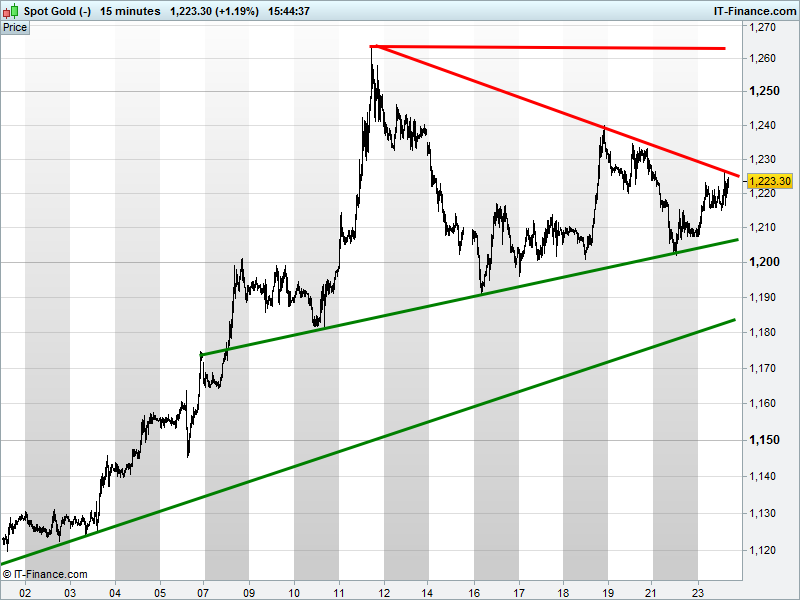
Spread bets and CFDs are complex instruments and come with a high risk of losing money rapidly due to leverage.
Spread bets and CFDs are complex instruments and come with a high risk of losing money rapidly due to leverage. 69% of retail investor accounts lose money when spread betting and/or trading CFDs with this provider. You should consider whether you understand how spread bets and CFDs work and whether you can afford to take the high risk of losing your money.