This report is not a personal recommendation and does not take into account your personal circumstances or appetite for risk.
UK 100 Index Focus – 7 Apr
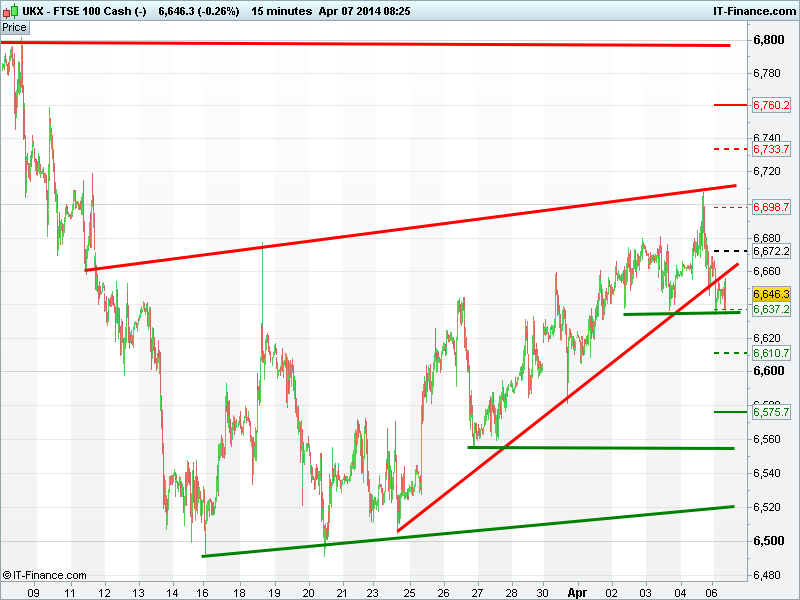
Major Support & Resistance (pivot points – explained):
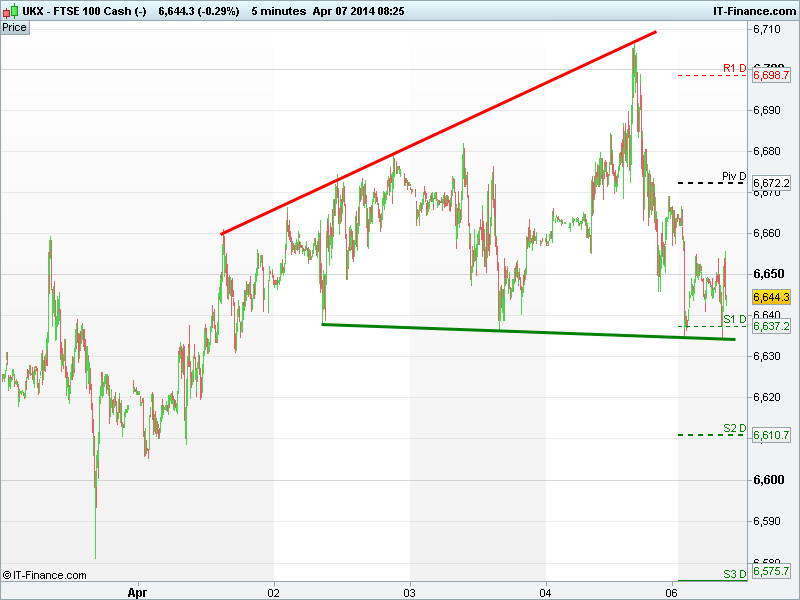
Pivot Point: 6672; Support 1, 2 & 3: 6637, 6611, 6576; Resistance 1, 2 & 3: 6699, 6734, 6760
Friday’s US jobs report initially helped the UK index move on up to test the key 6700 level, however, this was short-lived with focus being less on the return to near 12-month average US job additions, upward revisions and improved participation rates, and more on the flat unemployment rate, the consensus miss and how the report made it difficult to decipher how it will influence the Fed’s decision on its stimulus run-down. All focus to revert back to the ECB now?
Early weakness has found support at the shallow trendline around 6635. This could provide a platform for renewed bullishness, but much progress may be a little too much to ask today with some reluctance to place bets ahead of the start of the key US earnings season (Alcoa tomorrow, JPMorgan Friday). The latest quarterly updates on sales, earnings dividend growth and guidance will be of much interest in relation to the US economic recovery versus the rest of the world. How results fare versus consensus will also be sure to impact global sentiment.
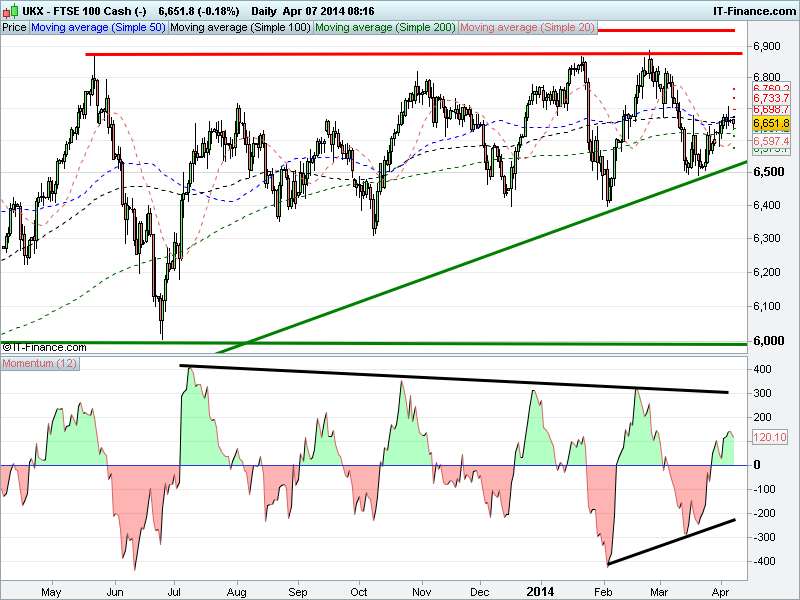
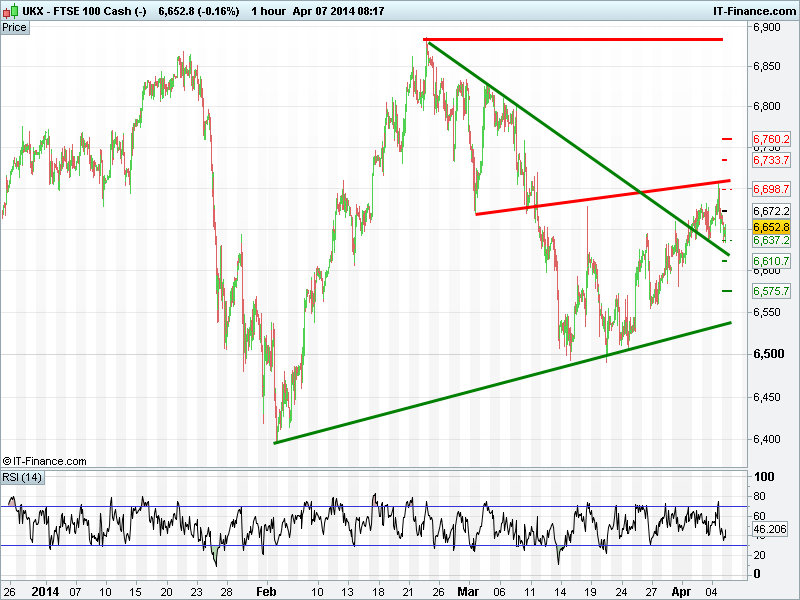
Beware the 3-month chart still highlighting downside potential to 6550, in-line with the long term. Upside potential open to Friday’s highs near 6710.
Click below to view graphs
Solid Green line
Possible support
Solid Red line
Possible resistance
- Trend: Sideways, break above falling Feb highs, rising resistance
- Potential support: 6635
- Potential resistance: 6710, 6875
Important: The information provided above does not constitute advice or opinion and must only be regarded as technical observations.
Click here for help with Support & Resistance Click here for help with technicals
Back to Top
This research is produced by Accendo Markets Limited.
Research produced and disseminated by Accendo Markets is classified as non-independent research,
and is therefore a marketing communication. This investment research has not been prepared in accordance
with legal requirements designed to promote its independence and it is not subject to the prohibition on
dealing ahead of the dissemination of investment research. This research does not constitute a personal
recommendation or offer to enter into a transaction or an investment, and is produced and distributed for information purposes only.
Accendo Markets considers opinions and information contained within the research to be valid when published,
and gives no warranty as to the investments referred to in this material. The income from the investments referred to may go down as well as up,
and investors may realise losses on investments. The past performance of a particular investment is not necessarily a guide to its future performance.
Prepared by Michael van Dulken, Head of Research