This report is not a personal recommendation and does not take into account your personal circumstances or appetite for risk.
UK 100 Index Focus – 20 Jan
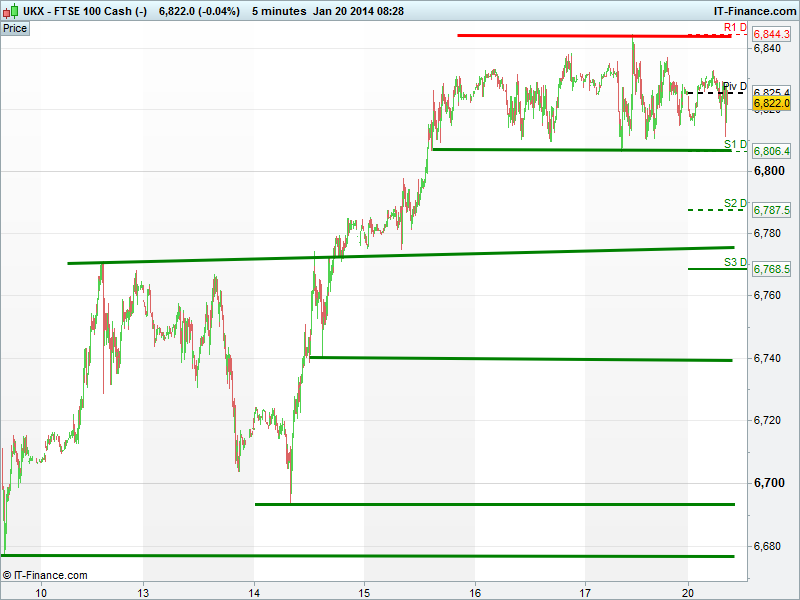
Major Support & Resistance (pivot points – explained):
Pivot Point: 6828; Support 1, 2 & 3: 6806, 6788, 6769; Resistance 1, 2 & 3: 6844, 6863, 6882
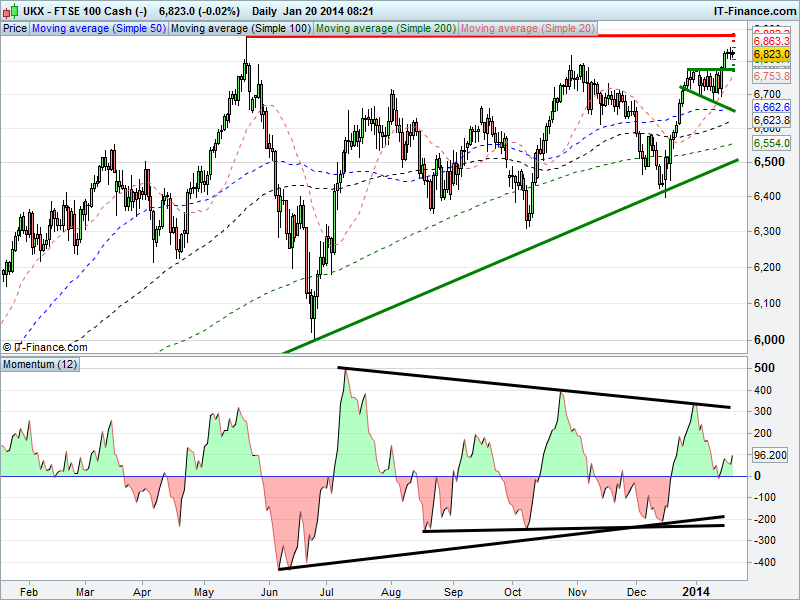
From one holding pattern to another. Not the most exciting of moves, but bulls are pleased that the shift is at least upwards and opportunities remain for swing traders playing within the boundaries. We are now oscillating around the 6820 highs of last October and the test to 6845 on Friday shows appetite remains for a try at 6875 May-highs.
While the Daily momentum indicator is back pointing North, concerns do relate to the 3-month hourly RSI having corrected back from the overbought with no price action following suit – negative divergence.
Sentiment held back by a combination of 1) mixed US macro data and hawkish Fed comments last week, offset by 2) a US market holiday today (Martin Luther King Day), 3) proof that Chinese growth is slowing (although less so than expected) and 4) uncertainty around US corporate results/outlook and whether they justify lofty equity multiples following the 2013 rally, and 5) a weekend profits warning by German Investment bank major Deutsche Bank.
Given the aggregate of the above, the fact the index is flat is a good showing for the start of a new trading week. Could there be more progress and another breakout this week? Not the busiest of macro calendars to contend with this week (especially today) but German/Eurozone ZEW surveys, UK Unemployment and Eurozone PMI Services readings could spice things up. Have a good week.
Solid Green line
Possible support
Solid Red line
Possible resistance
- Trend: Sideways, breakout, trading around Oct highs, RSI retraced from overbought
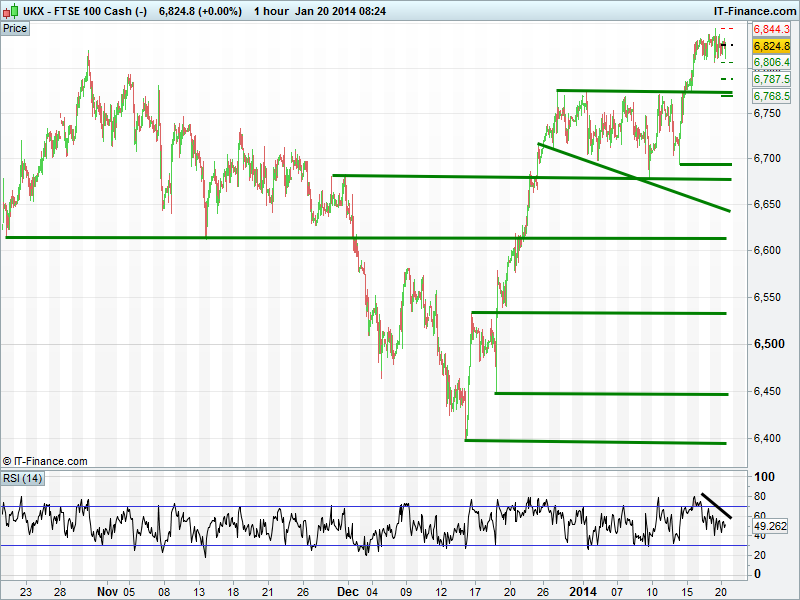
- Potential support: 6805, 6775, 6695, 6680
- Potential resistance: 6845
Important: The information provided above does not constitute advice or opinion and must only be regarded as technical observations.
Click here for help with Support & Resistance Click here for help with technicals
Back to Top
This research is produced by Accendo Markets Limited.
Research produced and disseminated by Accendo Markets is classified as non-independent research,
and is therefore a marketing communication. This investment research has not been prepared in accordance
with legal requirements designed to promote its independence and it is not subject to the prohibition on
dealing ahead of the dissemination of investment research. This research does not constitute a personal
recommendation or offer to enter into a transaction or an investment, and is produced and distributed for information purposes only.
Accendo Markets considers opinions and information contained within the research to be valid when published,
and gives no warranty as to the investments referred to in this material. The income from the investments referred to may go down as well as up,
and investors may realise losses on investments. The past performance of a particular investment is not necessarily a guide to its future performance.
Prepared by Michael van Dulken, Head of Research