The information on this page is not a personal recommendation and does not take into account your personal circumstances or appetite for risk.
Introduction
As previously discussed, Support and Resistance are key price levels highlighting the relative enthusiasm of buyers and sellers. These levels display the psychology of the different market participants at those levels. The symmetrical triangle is usually considered a continuation pattern, essentially a pause before the original direction is resumed.
Symmetrical
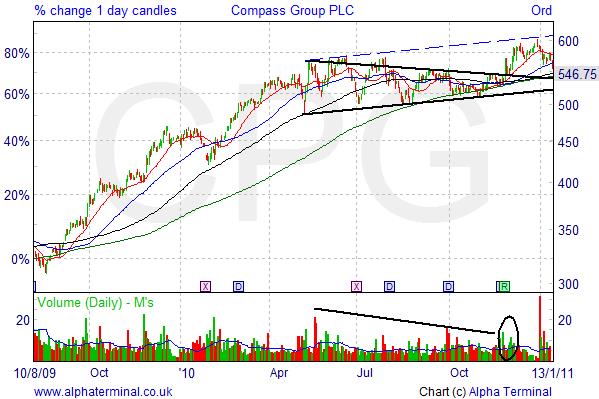
A Symmetrical Triangle pattern is formed by identifying at least 2 lower highs and at least 2 higher lows. When trendlines are drawn across the highs and the lows they normally converge, thus forming a symmetrical triangle pattern. Usually a continuation pattern, they can also lead to reversals in trend. As always, however, confirmation is required, in this case via a valid breakout from the pattern, before we can know in which direction the breakout will be. The price target for the following move is calculated by A) taking the width point of the base of the triangle and projecting it upwards from the breakout point, or B) placing an extended line parallel to that of the triangle which slopes is in the direction of the breakout.

Requirements
1) An existing trend is required so that the triangle has something to continue or reverse.
2) Trading volume should be falling (calm before the storm) as we move through the triangle,
3) The pattern normally takes 3 months to form, but can be shorter (less than 3 weeks is normally considered a
Pennant).
4) Breakout should occur between ½ and ¾ of the way through the pattern. When we extend the trendlines to join
(the apex) we can estimate the duration of the pattern and the expected breakout zone. If the price action moves
beyond the ¾ point, the pattern becomes suspect. Breakouts before ½ could be premature.
5) A valid breakout (on increased volume if break is to upside) is needed before we know where the price could be
headed.
Our working example shows a breakout between ½ and ¾, on higher volume and a parallel trendline target being met.
Caveat
Individual technical indicators should never be relied upon in isolation for trading decisions, however strong the signal may be. Ultimately they are one of many indicators, which may, in the majority, be pointing the other way. Always use look at other indicators (moving averages, trendlines, price, price patterns, volume) to assist in the final trading decision. Lastly, the current trend of a share should always be respected – preempting a change can prove costly.