Tullow Oil
A trading opportunity for you?
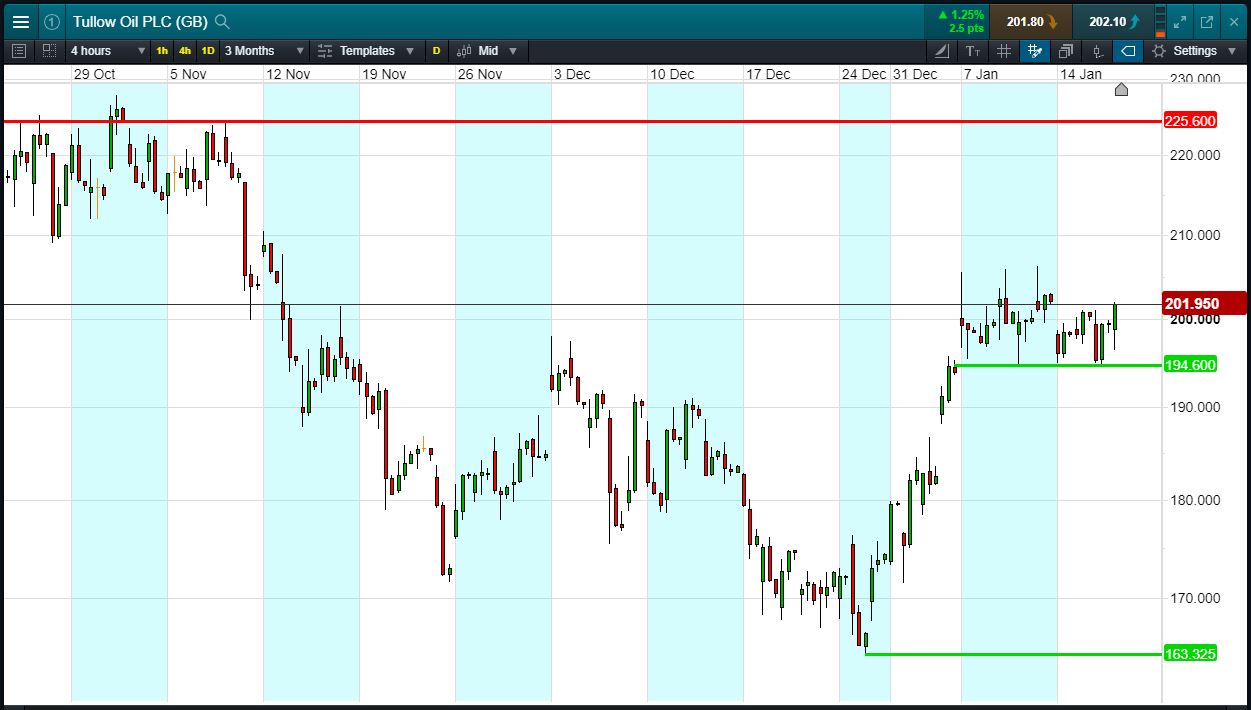
Will Tullow break support, or will it rise again back to 225p highs?
- Tullow has support at 194p since mid-December, bouncing 6 times
- Now trading 202p (at time of writing).
- Will the pattern repeat itself? Will the shares bounce off support again?
- Bullish flag pattern?
- Shares -28.5% from 2018 highs; +22.3% from 2018 lows; +13.6% year-to-date.
- 16 Jan: Citigroup says Tullow Oil has strong momentum, upbeat outlook
- 20 Dec: Tullow receives conditional approval for Uganda oil fields divestment
- 29 Nov: Tullow Oil to reinstate dividend in 2019 after ‘excellent’ progress
- Source: Bloomberg, FT, Reuters, DJ Newswires, AlphaTerminal
Click to enlarge
Trading Tullow – An Example
Let’s say you like the Tullow chart and you think the price is heading back towards 225p again. You decide to buy exposure to £10,000 worth of Tullow using a CFD, at the current price of 202p. To do this, you need £2,000.
Let’s assume Tullow rises back to 225p (+11.4%). Your profit would be £1140, from your initial investment of £2,000.
Conversely, let’s assume you open the above position, and place a stop-loss at 5% from the current price. Tullow falls 5% and hits your stop-loss. Your loss would be £500.
This is provided for information purposes only. It should not be taken as a recommendation.