RBS
A trading opportunity for you?
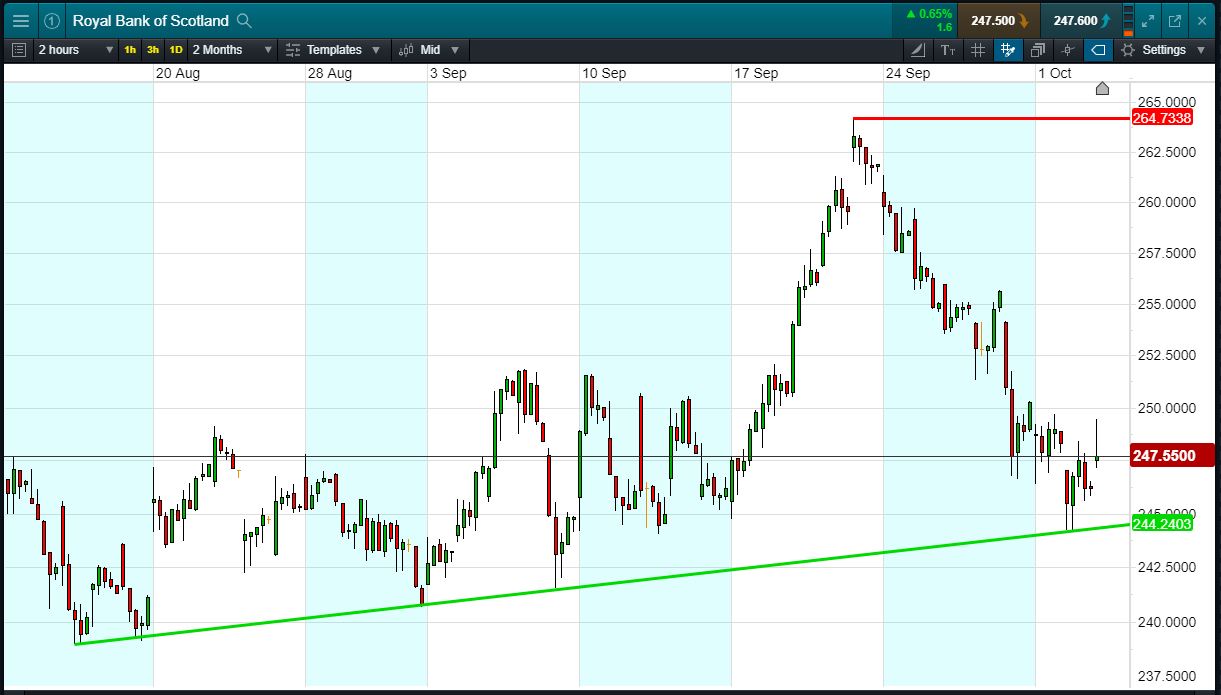
Will RBS break support, or will it rise again back to 264p ?
- RBS has shallow rising support since mid-August
- Bounced off 244p to make it a 5th bounce off the trendline.
- Now trading 247.5p (at time of writing)
- Will the pattern repeat itself, bouncing up again towards 264p recent highs?
- Shares -19.1% from 2018 highs; +3.2% from 2018 lows; -11.0% year-to date
- Banks pressured recently by Italian peers down sharply on concerns about Italian budget
- 27 Sept: RBS plans to launch mobile-only lender Bo in 2019
- RBS has restarted dividend payments and the government wants to continue selling down its stake (62.4%).
- Source: Bloomberg, FT, Reuters, DJ Newswires
Click to enlarge
Trading RBS – An Example
Let’s say you like the range, you think it’s heading back towards 264p again. You decide to buy exposure to £10,000 worth of RBS using a CFD, at the current price of 247.5p. To do this, you need £2,000.
Let’s assume RBS recovers back to 264p (+6.7%). Your profit would be £670, from your initial investment of £2,000.
Conversely, let’s assume you open the above position, and place a stop-loss 3% below the current price. RBS falls 3% and hits your stop-loss. Your loss would be £300.
This is provided for information purposes only. It should not be taken as a recommendation.