Redrow
A trading opportunity for you?
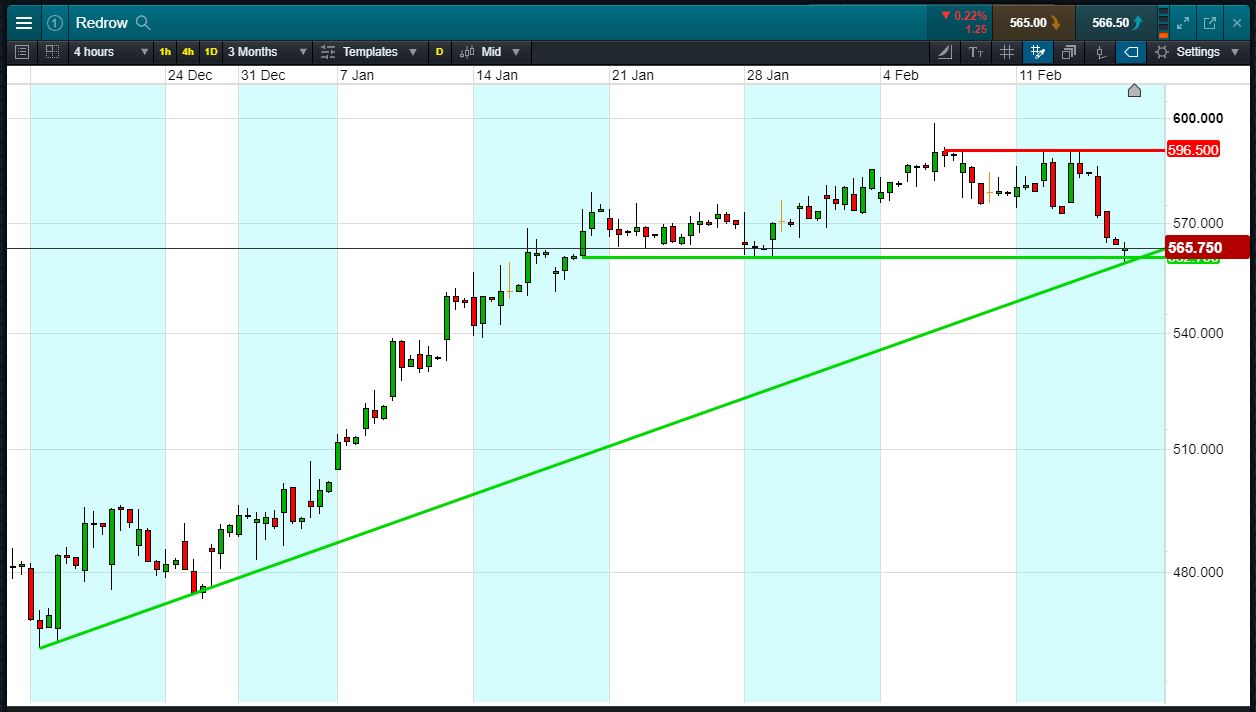
Will Redrow break support, or will it rise again back to 596p highs?
- Rising support since late Dec; horizontal since mid-Jan
- Latest bounce at 561p to trade 565p (at time of writing).
- Will the pattern repeat, the shares climbing back towards 596p?
- Shares -15.0% from 2018 highs; +24.2% from 2018 lows; +15.1% year-to-date.
- 6 Feb: Citigroup says market estimates for Redrow to rise after upbeat H1
- Source: Bloomberg, FT, Reuters, DJ Newswires, AlphaTerminal
Click to enlarge
Trading Redrow – An Example
Let’s say you like the Redrow chart and you think the price is heading back towards 596p again. You decide to buy exposure to £10,000 worth of Redrow using a CFD, at the current price of 565p. To do this, you need £2,000.
Let’s assume Redrow rises back to 596p (+5.5%). Your profit would be £596, from your initial investment of £2,000.
Conversely, let’s assume you open the above position, and place a stop-loss at 2% from the current price. Redrow falls 2% and hits your stop-loss. Your loss would be £200.
This is provided for information purposes only. It should not be taken as a recommendation.