KAZ Minerals
A trading opportunity for you?
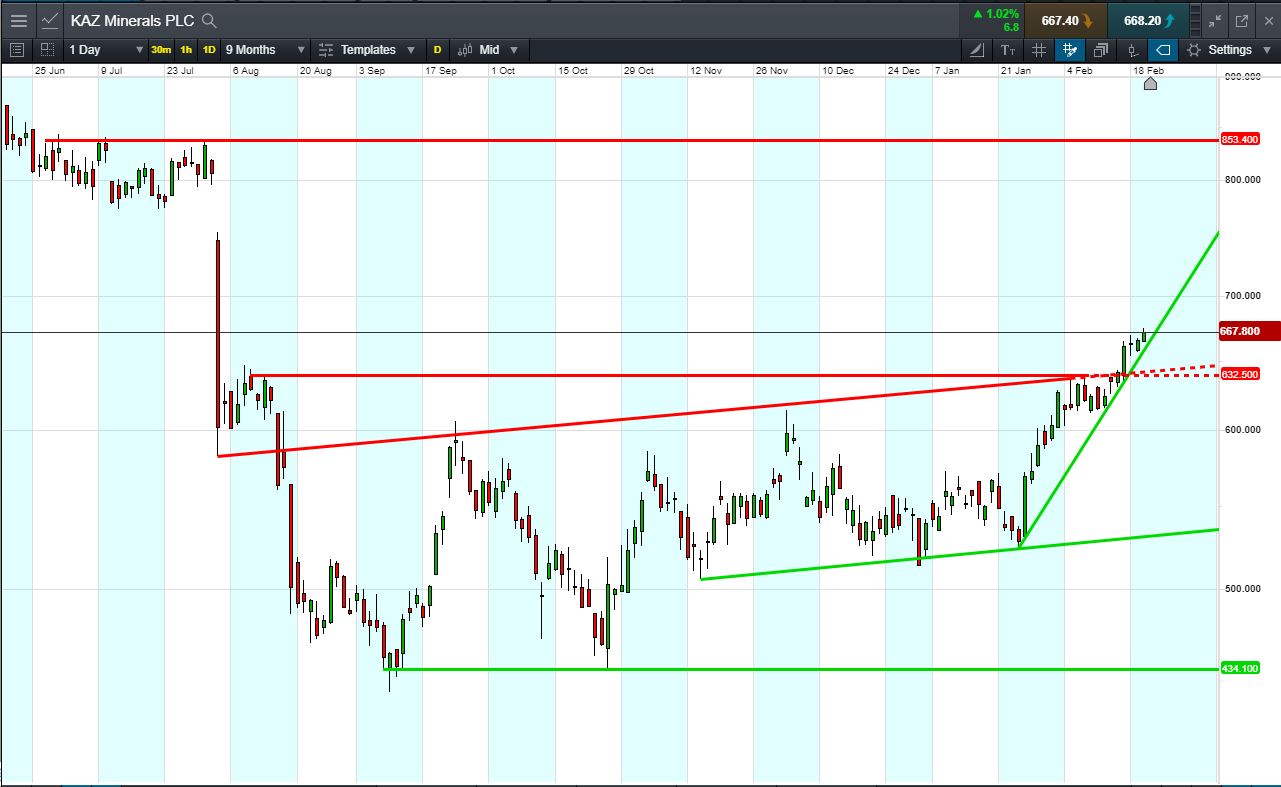
Will KAZ Minerals break support, or will it rise again back to 853p ?
- Steep rising support at 651p to trade 666p (at time of writing).
- Double breakout above 652p recent highs.
- Will the pattern repeat? Will the shares bounce to 853p again?
- Shares trade at 2019 highs; +33.9% from 2019 lows; +25.2% year-to-date.
- 24 Jan: Miner’s copper production hit upper end of guidance range.
- Source: Bloomberg, FT, Reuters, DJ Newswires, AlphaTerminal
Click to enlarge
Trading KAZ Minerals – An Example
Let’s say you like the KAZ Minerals chart and you think the price is heading back towards 853p again. You decide to buy exposure to £10,000 worth of KAZ Minerals using a CFD, at the current price of 666p. To do this, you need £2,000.
Let’s assume KAZ Minerals rises back to July 2018 highs of 853p (+28%). Your profit would be £2800, from your initial investment of £2,000.
Conversely, let’s assume you open the above position, and place a stop-loss at 7% from the current price. St James’s Place falls 7% and hits your stop-loss. Your loss would be £700.
This is provided for information purposes only. It should not be taken as a recommendation.