Banking on a return to certainty?
There’s no charge for this.
This report is not a personal recommendation and does not take into account your personal circumstances or appetite for risk.
Shares are seldom static at the best of times, with banks exposed daily to global events, and reporting season is no exception. Are you aware that the big four UK banks have an average results day trading range of over 5%? This means they offer the magnitude of volatility that short term traders crave.
Furthermore, are you aware that since the banks last reported (Q1; end-April) their respective share prices have delivered anything from a gain of 9% to a loss of 11%, suggesting these stocks offer opportunities far beyond those around results days themselves?
It’s often handy to keep an eye on the US banks that typically report a week or two ahead of their UK counterparts – since US banks have international fallout and a big presence in the City of London.
In mid-July we’re due announcements from six of the major US banks:
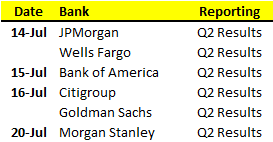
What will drive stateside results this earnings season? Will we see litigation feature more or less strongly. Will profits do better than the 7% gains they registered in Q1, as revenues increased and loan delinquency continued to improve with the number of problem banks falling to a 6yr low (Source: FDIC, 27 May)?
Ahead of results make sure you are aware of consensus expectations (as they emerge, receive updates from your broker), as well as ensuring you are provided with an update when the results are released on the day (normally 7am, before the UK market opens).
UK Banks Q2 Reporting Dates

Since the UK banks last reported at the end of April/early May (Q1 results) their share prices have delivered rather mixed performance ranging from gains of 9.0% to losses of 11.6%.
In addition we expect updates from the new UK Challenger banks Shawbrook, Virgin Money and Aldermore, all of which have delivered sterling performances (+20 to 60%) since their IPOs, and Asia-focused heavyweight Standard Chartered. Contact us if these names are of interest and you want more information.
Now let’s look at the big four UK banks in more detail:
Barclays was an enigmatic stock following its Q1 interim management statement. While pre-tax profits rose 9%, statutory profit (the more realistic number) was down a whopping 26% after the bank set aside £2.05bn in expected fines for its part in rigging forex markets.
A fortunate escape?
As it happened, Barclays was only fined £1.5bn, leaving £550mn in the coffers with the potential for a significant write back in Q2. Keep an eye out for this.
Shares in Barclays have spent the last 5 years in a sideways range bounded largely by the current best and worst broker target prices. It seems the less-harsh –than-expected punishment at the hands of US and UK regulators may have been taken as a buying opportunity, with no subsequent break of the 8-month uptrend.
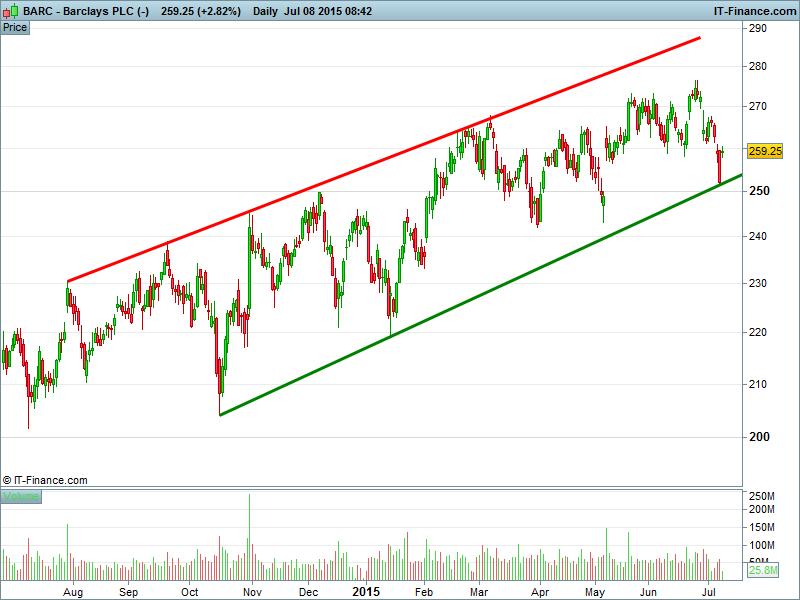
Source: IT Finance, 8 July 2015
The fact that Barclays was not bailed out in the aftermath of the 2008 crash, allowing it to make the most if its highy successful investment banking arm, also works in its favour. UK peers Lloyds and RBS have seen nothing like the recovery Barclays has to date. But have investors now missed ‘le barque’ with Barclays?

Source: IT Finance, 8 July 2015
Shares in Barclays are trading roughly in a range between the most bullish (350p) and most bearish (200p) broker target prices that suggest potential for revisits of 4-year highs and 4-year lows respectively, but which?
With shares sitting between the bears and the average target price, and in an upwards trending channel, the outlook may be seen as more bullish than bearish for Barclays. Could 300p prove a realistic target? Will that potential Q2 write-back emerge end-July and give shares another lift?
Note that while 72% of the broker recommendations are a ‘buy’ the average target price is near the actual share price which could mean resistance around 290p – these things are often self-fulfilling.
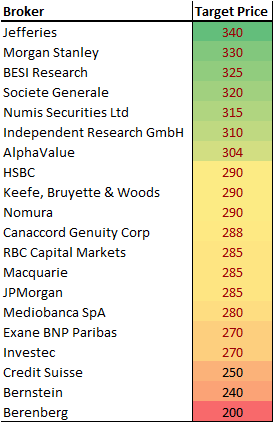

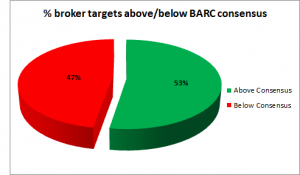
Source: Bloomberg, 3 Jul 2015
Will further reported growth (aka recovery) reinforce what BARC has already reported so far this year? Are we due a small correction before a resumption of the uptrend? Are we due a major correction following a potential breakdown in Eurozone relationships (Grexit, Brexit….) and broad market sell-off?
Remember, Accendo Markets offers you the chance to profit from share price movements irrespective of whether they go up or down.
In early Q2 HSBC managed to steer attention away from scandal and on to its future as a UK headquartered bank when, after being ordered to ring-fence its retail operations, it was first to suggest it might be better off based somewhere without such regulatory and tax burdens. The prospect of lower costs helping profits drew investors back in to the stock through April following a torrid few months previous.
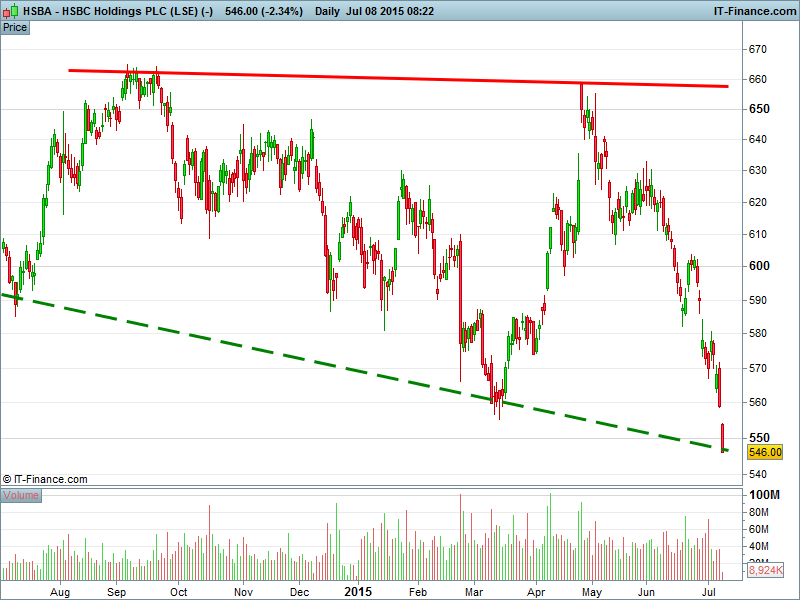
Source: IT Finance, 8 July 2015
Meanwhile, analysts suggested a possible improvement in profits as Q1 results season approached with income and a renewed focus on costs & margins the major drivers.
In reality the results missed consensus, reinvigorating the bears and returning the stock to a downtrend that has persisted to date though we note an early July bounce off 5-month rising support near March 13 lows 555p.
Is now the time to get in to HSBC? Do you perceive HSBC’s exposure to Greece as threatening or opportune?

Source: IT Finance, 8 July 2015
With shares now having dipped below that rising support and much negative press for the ‘world’s local bank’ likely impeding upwards progress, does what the brokers think carry that much weight anyway? Yes, because investors don’t tend to get bogged down in ethics. They just want to make money.
That said, what are the brokers saying?

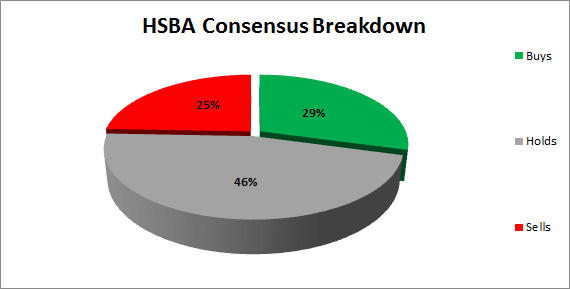
Source: Bloomberg, 3 Jul 2015
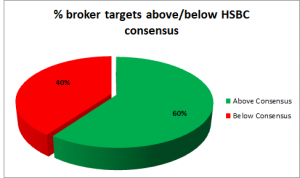
Price targets from 25 institutions show an average around the ‘Neutral’ or ‘Hold’ rating. Nonetheless, 60% of the brokers’ target prices are still above the current consensus target.
This suggests some near-term upside potential (although watch out for Greece…) for the stock with the possibility for shares to return at least to that average broker target of 650p, though we note the possibility of an impending dead cross by the 50-day and 200-day moving averages in July. These types of moving average cross usually act as delayed trend confirmation, so it is still possible that a reversal could take place.
Lloyds Banking Group was the only UK bank to exceed expectations for Q1 results and with the government busy offloading its stake as we write (holding now down to less than 16%), Lloyds could be free of public scrutiny within a year from now.
The question is what does the divestment mean for prices? Will the newly privatised bank prove a bargain investment now, or when all its shares are again publicly traded? What about its planned return to dividends after so many years without?
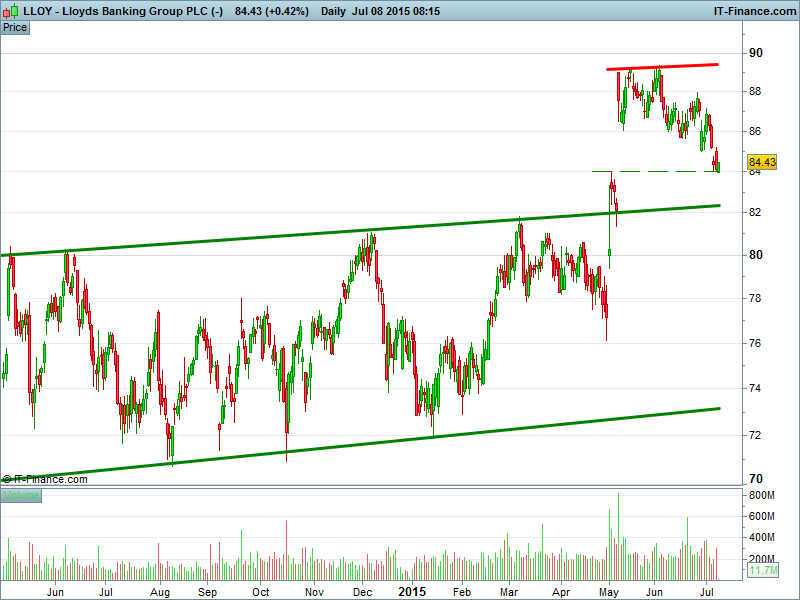
Source: IT Finance, 8 July 2015
Shares traded in a range for much of the past year before breaking out after the election to meet resistance 8.5% above prior highs around 89p. That gap has now technically been filled while the 50- and 200-day moving averages indicate an uptrend for the stock.
Will the market allow shares to fall further and breach 82p support, putting the stock back in its prior trading range? Will shares make a bounce back up towards the consensus target at what would be 6-year highs 91p?

Source: IT Finance, 8 July 2015
Brokers are tipping the stock at worth anything from 55p to 105p, with shares seemingly preferring to set sail for the latter of late. 90p looks set to be the first hurdle – will another consensus-beating set of results at the end of July lift the bank over it?
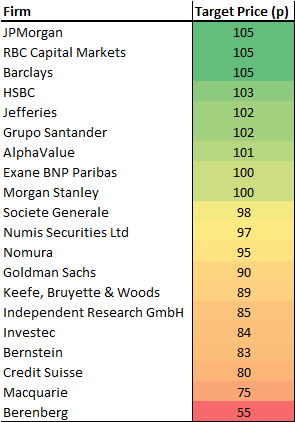
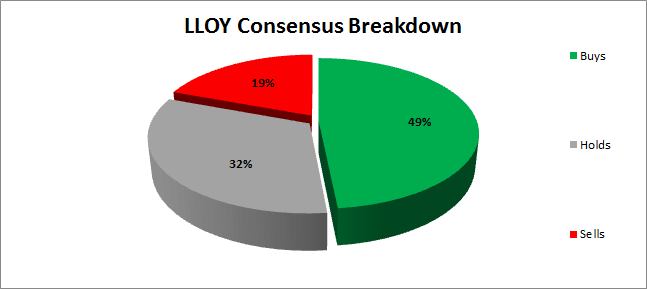

Source: Bloomberg, 3 Jul 2015
Looking at the above light map we note nearly half of all broker consensus target prices at or above 100p which means around 15% upside potential if these brokers have called it right.
7 years after it was bailed out during the financial crisis, RBS remains 79% taxpayer-owned. With RBS considerably larger than Lloyds Banking Group, that’s a lot of stock! The government is likely to begin offloading this stake later in the year - so it looks like it’ll be a while before the bank is fully returned to private ownership.
The litigation nightmare remains as present at RBS as it does at many other major banks, with potential penalties totalling $13bn for misconduct relating to US mortgage backed securities although the return to private hands will start irrespective of when and how seriously the penalties are imposed.
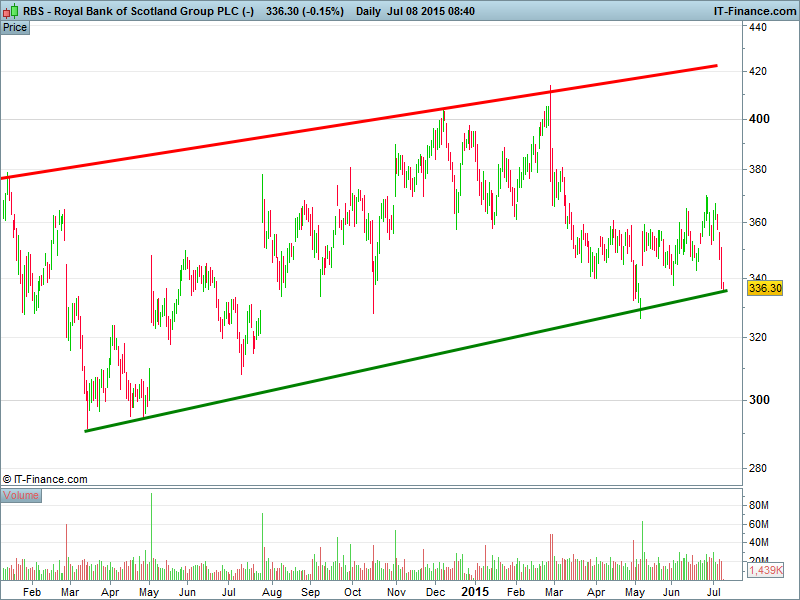
Source: IT Finance, 8 July 2015
Fines and settlements often signal an end to woes – think Barclays and, recently, BP. Shares often rally on ‘it can only go one way from here’ sentiment. Shares in RBS have been in a rising channel since mid-2012 and, while moving averages are signalling a downtrend, the stock has failed to breach solid rising support since then.
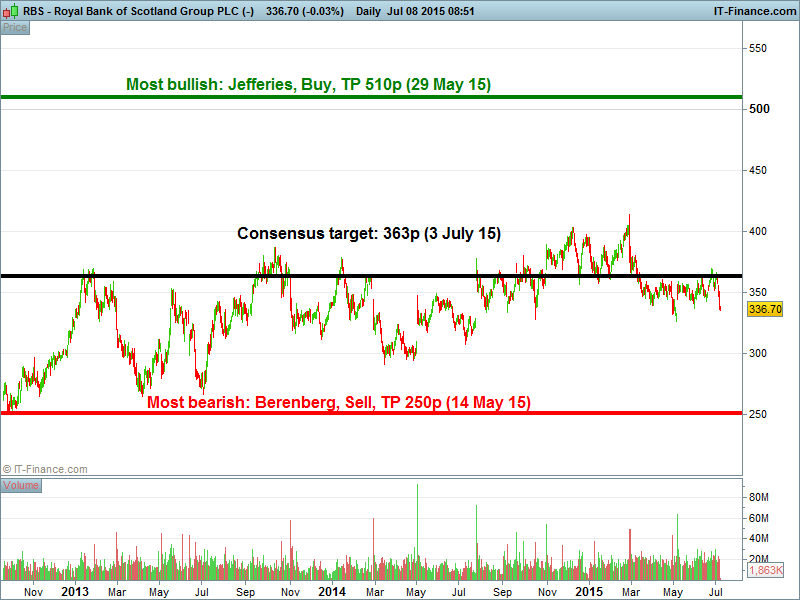
Source: IT Finance, 8 July 2015
Note RBS shares are trading close to the consensus target 363p. However, that strong rising support could see them rise steadily through this. Jefferies wading in on 29 May, long after Berenberg gave its negative verdict on the stock, is clearly bullish and likely looking towards closure on legal problems and the government’s full divestment to help drive the price back towards levels last seen in Nov 2007.
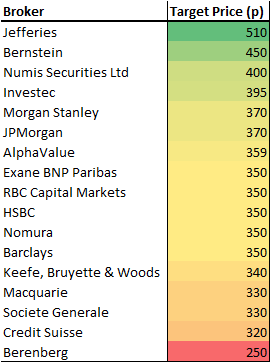
Source: Bloomberg, 3 Jul 2015
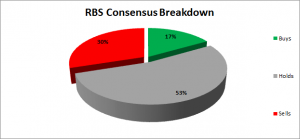
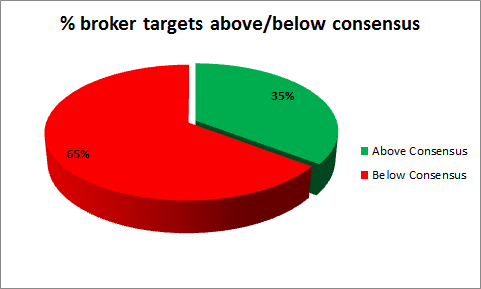
The average broker target on RBS is ‘hold’ which, while not an explicit ‘buy,’ nonetheless indicates market confidence that RBS shares have the potential to maintain value within a portfolio. One concern is the number of target prices below the consensus average, which in the case of RBS is a 65/35 split in favour of the bears.
Like Lloyds, though, the downside potential for RBS is likely to be short-term from here, making results day a key event to watch. Will provisions made for US litigation impact profits significantly in Q2? Or will markets view such provisions as a ‘line drawn’ under a tough few years for the sector?
Shares in UK Banks tend to be closely watched by short-term traders and long-term investors alike, making them important both from a markets point of view and because they often represent the cornerstone of a portfolio. If you want to trade or invest, Accendo Markets is here to help keep you in the loop.
If something major is announced, when will you find out? That day? The next? One of the benefits of working with Accendo Markets is getting a call from your trader in-time and on-time, not just sometime.
Broker updates, especially those from the big player like Goldman Sachs, often impact the share price. If you have an interest in the banks, you need to be kept informed of these developments as and when they happen!
We’re here to make sure you are in a position to trade the banks in the most cost effective manner with our award-winning trading and markets-focused research service.
At Accendo Markets we don’t tell you what to do. It’s your call whether you buy or sell. Our aim is to provide the help you need, highlight potentially profitable opportunities and assist you in making trading decisions enabling you to benefit from the use of leveraged instruments.
Our approach focuses on 3 elements below:
Our unique and award-winning service provides you with the help and tools you need to make appropriate trading decisions in the financial markets, both to grow and protect your capital.
This research is produced by Accendo Markets Limited. Research produced and disseminated by Accendo Markets is classified as non-independent research, and is therefore a marketing communication. This investment research has not been prepared in accordance with legal requirements designed to promote its independence and it is not subject to the prohibition on dealing ahead of the dissemination of investment research. This research does not constitute a personal recommendation or offer to enter into a transaction or an investment, and is produced and distributed for information purposes only.
Accendo Markets considers opinions and information contained within the research to be valid when published, and gives no warranty as to the investments referred to in this material. The income from the investments referred to may go down as well as up, and investors may realise losses on investments. The past performance of a particular investment is not necessarily a guide to its future performance. Prepared by Michael van Dulken, Head of Research