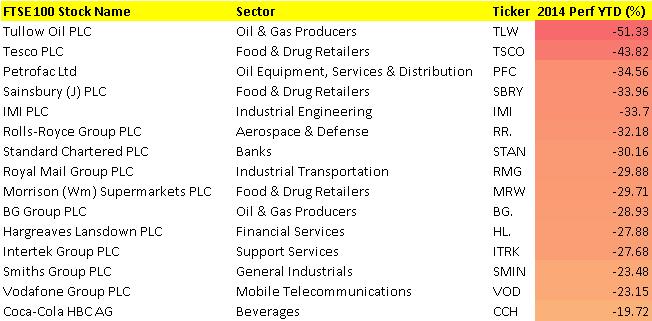
A selection of major names has both risen and fallen by between 20 and 60%. Not negligible moves in an environment where your cash at the bank earns you nothing after inflation. Some stocks will offer recovery potential in 2015, while others will push higher. Some will offer correction opportunities while others will keep leaking.
The outperformers, such as Shire (SHP) and AstraZeneca (AZN) have benefited from M&A, even though nothing came of talks and deals. Could 2015 see predators return for a second bite at the prey?
The underperformers such as Tullow Oil (TLW) and Tesco (TSCO) have suffered from falling commodity prices (notably oil) and a nasty combination of supermarket sector problems (price competition) and issues closer to home (accounting irregularities). Worries overdone and set to recover? Or worse to come?
Whether a trading opportunity exists is something that only you can decide, and if you want to look at the full list of the UK’s 350 biggest stocks click here for the full 2014 Performance breakdown to help you make your decision.
Lots of these stocks are heavily traded by UK investors / traders and represent the cornerstone of many a portfolio. If you own or trade any of the names above with Accendo Markets or indeed elsewhere, we are here keep you abreast of all developments you need to make informed decisions.
If something major is announced when will you find out? That day? The next? The benefit of working with Accendo Markets is getting a call from your trader in time not just sometime.
For 10 stocks we believe are worth watching for 2015, read on
———————————————————-
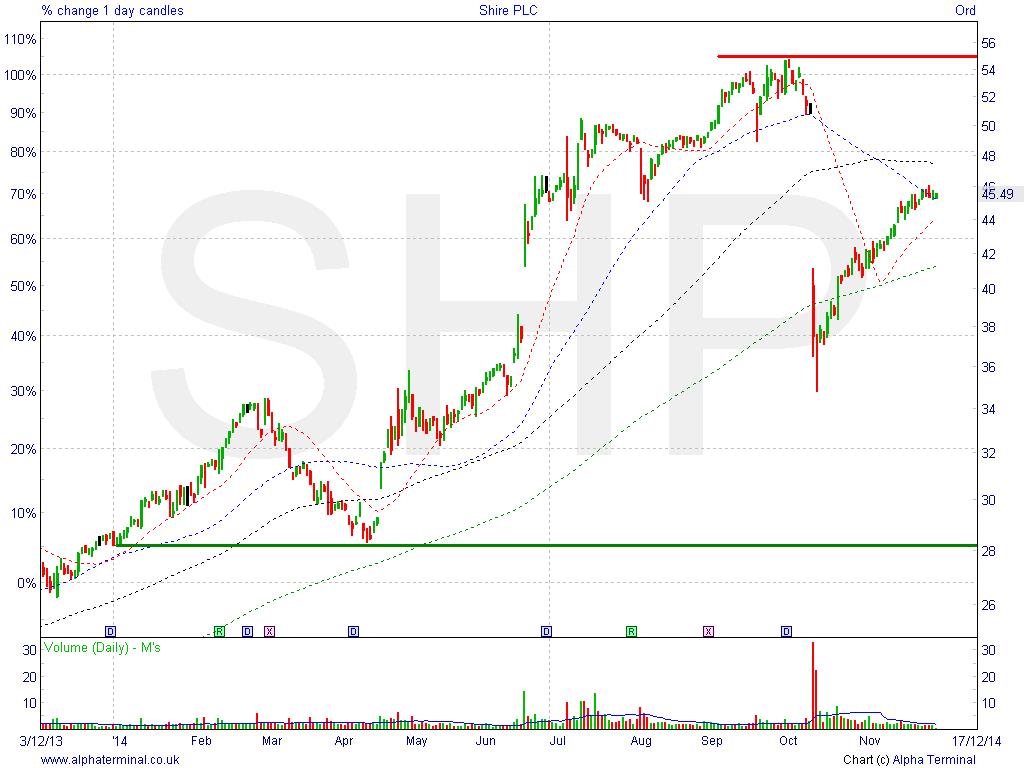
Shire (SHP) - Healthcare;
1-month 8.9%, 3-month, -7.7%, 12-month 67.4%
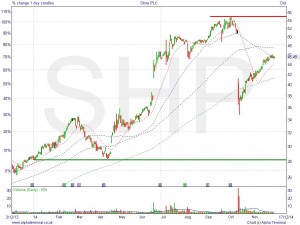
Source: AlphaTerminal; green and red lines indicate potential support and resistance
Will the price rise towards 2014 highs of 5500p or will it fall below lows of 2800p?
Summary: Shire (SHP) has benefited this year from a raft of healthcare merger and acquisition deals, some of which have come to fruition and others which have not. While US group AbbVie (ABBV) pulled out of its tax-decreasing focused deal, due to changes in US law to counter such deals SHP has continued to rise, on hopes that low borrowing costs will persist and fuel yet more M&A in 2015, with AbbVie coming back or another suitor presenting itself. FY14 results: mid-Feb
Technicals: After the fall back on the M&A deal collapse, support kicked in around the June breakout level 3800p. Having bounced here this could serve as support again for any weakness. Rising lows towards abandoned highs suggests potential healthy upside and for the gap to be filled to 5200p.
Latest Broker Consensus: 18 x Buy, 7 x Hold, 0 x Sell
3-Dec, Morgan Stanley, Overweight, TP 5200p; 25-Nov, Citigroup, Buy, TP 4900p; 18-Nov, JPMorgan, Overweight, TP 4600p; 17-Nov, Berenberg, Hold, TP 4100p; 7-Nov, Credit Suisse, Neutral, TP 4200p; 4-Nov, UBS, Buy (U), TP 5000p (D); 28-Oct, Cenkos, Buy, TP 5347p; 27-Oct, Morningstar, Hold; 510p;
Source: Digital Look, Alpha Terminal, Bloomberg) (U = Upgrade / D = Downgrade; TP = Target Price)
———————————————————-
United Utilities (UU.) - Utilities, Water
1-month 5.3%, 3-month 3.2%, 12-month 38.3%
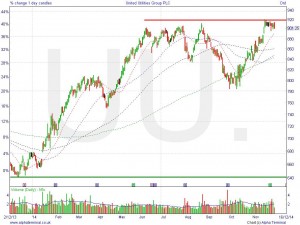
Source: AlphaTerminal; green and red lines indicate potential support and resistance
Will the price rise above 2014 highs of 920p or will it fall towards lows of 640p?
Summary: Amid the year’s M&A party, several utilities names have benefited from bid talk which has helped buoy shares and keep them near high for most of the year. Less exposed to global growth, it’s not surprising the shares have down well, even if they suffered amid the October market-wide downturn. Shares static since H1 results end-November. Attractive 4% dividend yield. Interim Statement: 30 Jan
Technicals: UU shares are in a 2014 uptrend, benefiting from rising lows and several attempts to breakout higher to make new all-time highs. Can this broken in 2015 or will we leak back from highs?
Latest Broker Consensus: 4 x Buy, 8 x Hold, 3 x Sell
27-Nov, SocGen, Hold, TP 770p; Deutsche, Buy, TP 1030p; 25-Nov, Whitman Howard, Hold, TP 960p; 12-Nov, Citigroup, Neutral, TP 875p; 7-Nov, Investec, Sell, TP 730p; 31-Oct, RBC, Neutral, TP 890p; 14-Oct, Morgan Stanley, Equalweight, TP 875p (U); 6-oct, JPMorgan, Neutral
Source: Digital Look, Alpha Terminal, Bloomberg) (U = Upgrade / D = Downgrade; TP = Target Price)
———————————————————-
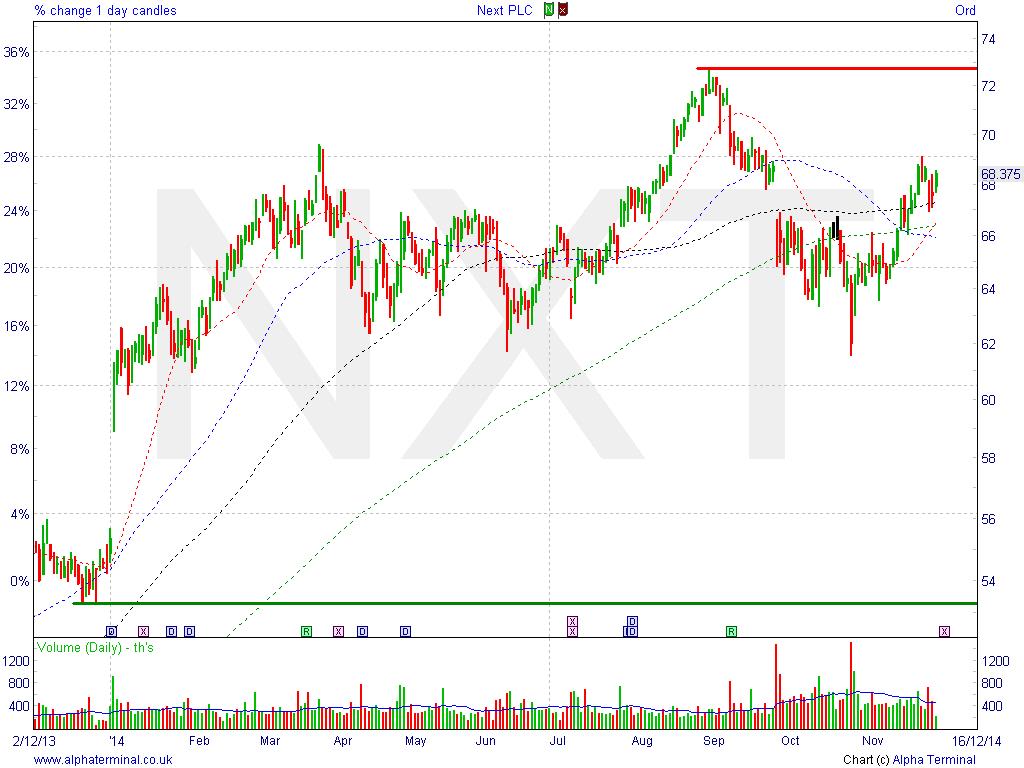
Next (NXT) - Retail, Clothing
1-month 5.9%, 3-month -4.9%, 12-month 26.4%
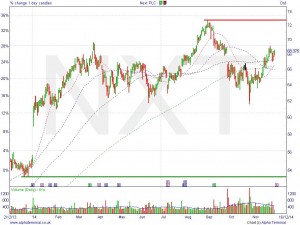
Source: AlphaTerminal; green and red lines indicate potential support and resistance
Will the price rise towards 2014 highs of 7280p or will it fall below lows of 5340p?
Summary: UK retailers have struggled in Q3 on account of warm weather postponing those big Winter purchases. Nonetheless, NXT’s embracing of a multi-channel offering including online and across including home-ware as well as clothing has seen it outperform peers for several years. A harsh winter could help. Consensus dividend of nearly 5% next year. Interim Ex-div: 4 Dec, Q4 Statement: 30 Dec
Technicals: Since mid-2014 the shares have shifted out of a tight 3yr rising channel, but have continued to try higher in March and September. Support present around 6150p since April. Can the shares keep warming up this winter, or will they get hung up?
Latest Broker 12-Month Consensus: 7 x Buy, 15 x Hold, 3 x Sell
27-Nov, Citigroup, Buy, TP 7700p; 26-Nov, Canaccord, Buy, TP 7500p; JPMorgan, Neutral, TP 7100p; 11-Nov, Cantor, Buy, TP 7100p; 7-Nov, Investec, Hold, TP 6800p; 4-Nov, ExaneBNP, Hold, TP 7250p; Berenberg, Buy, TP 7775p (D); 31-Oct, Peel hunt, Hold, TP 7100p; 30 Oct, SocGen, Hold, TP 6469p
Source: Digital Look, Alpha Terminal, Bloomberg) (U = Upgrade / D = Downgrade; TP = Target Price)
———————————————————-
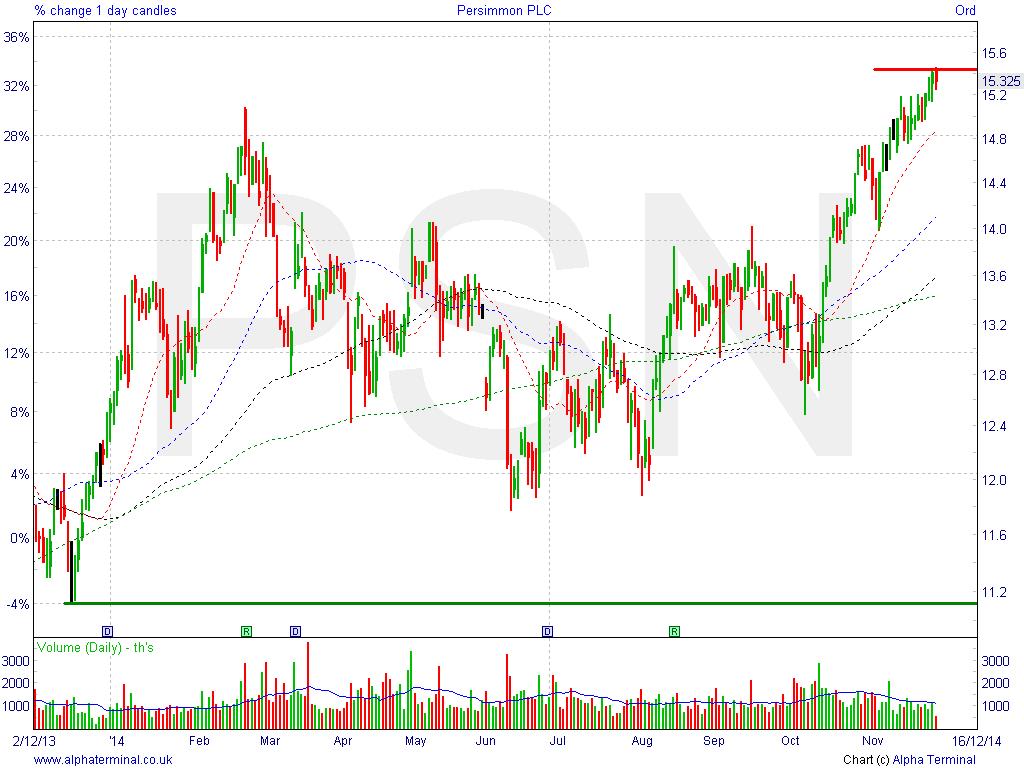
Persimmon (PSN) - House builders
1-month 4.2%, 3-month 14.6%, 12-month 31.7%

Source: AlphaTerminal; green and red lines indicate potential support and resistance
Will the price rise above highs of 1545p or will it fall towards lows of 115p?
Summary: Rising UK house prices fuelled by low interest rates and government schemes to help initially first time buyers then movers has helped UK House builders in 2014 with the threat of a UK rate rise in 2015 regularly pushed back by questionable global growth and sub-target UK inflation and wages growth that fails to match. A UK housing shortage should continue to provide support. Decent 4.5% dividend yield, forecast to be over 6% in 2015. Interim results: 7 Jan
Technicals: 2011 uptrend slowed up in mid-2013. 2014 seen sideways shift although October breakout from bullish ascending triangle pattern seen shares make new all-time highs. Will the shares build on 2014 strength and foundations or have they found a roof/ceiling?
Latest Broker 12-Month Consensus: 5 x Buy, 9 x Hold, 8 x Sell
3-Oct, Espirito Santo, Neutral, TP 235p (D); Shore, Hold; 2-Oct, ExaneBNP, Hold, TP 260p; SocGen, Hold, TP 260p; 1-Oct, Cantor Fitzgerald, Hold, TO 320p; Morningstar, Outperform; 26-Sept, Barclays, Overweight, TP 300p; 25-Sept, JPMorgan, Underweight, TP 225p (D); Deutsche, Hold, TP 275p;
Source: Digital Look, Alpha Terminal, Bloomberg) (U = Upgrade / D = Downgrade; TP = Target Price)
———————————————————-
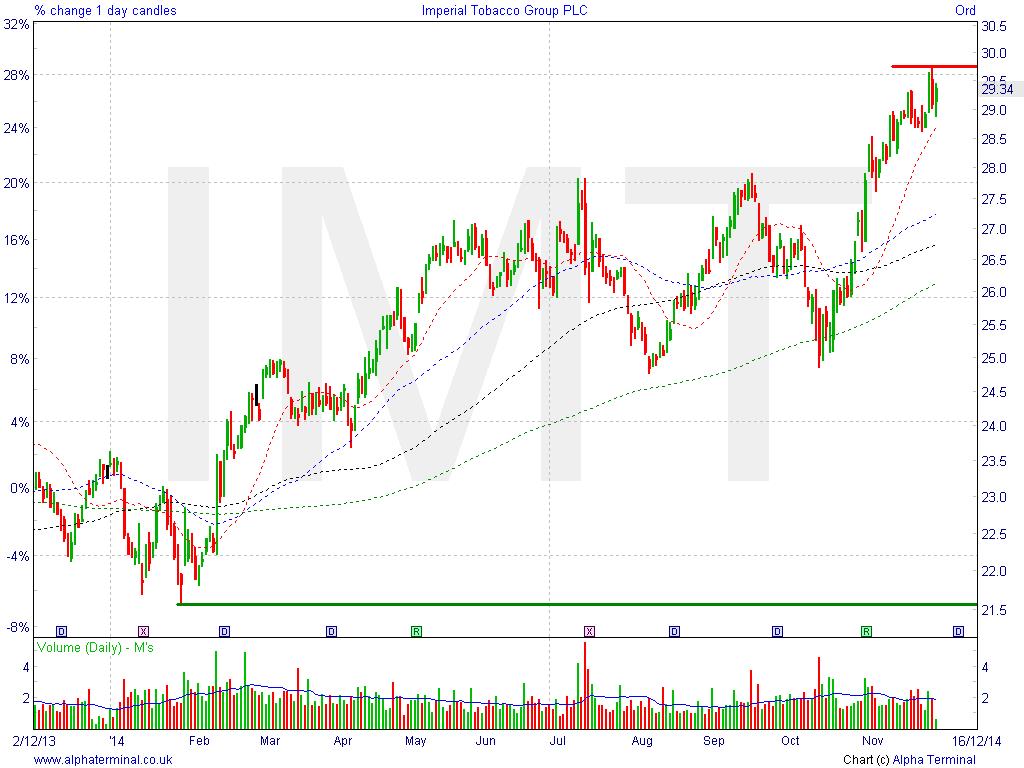
Imperial Tobacco (IMT) - Tobacco
1-month 7.8%, 3-month 11.0%, 12-month 26.4%
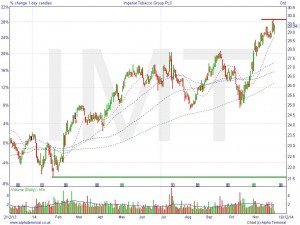
Source: AlphaTerminal; green and red lines indicate potential support and resistance
Will the price rise above highs of 2980p or will it fall towards lows of 2160p?
Summary: Certain defensives such as tobacco have done well in 2014, although IMT has fared better than competitor BATS despite strong currency headwinds. Regulatory changes are a risk, as is popularity of e-cigarettes. High dividend yield of 5% means widely held through economic thick and thin. Ex-div; 15 Jan Q1 Results: 17 Feb
Technicals: Shares in strong 2014 uptrend, just off all-time highs, with major support at breakouts 2480p and now potentially at 2790p. If Aug-Oct was pause, potential for Jan-Apr upside to be repeated. Will the shares keep smoking higher, or will investors stub them out?
Latest Broker 12-Month Consensus: 13 x Buy, 11 x Hold, 4 x Sell
17-Oct, JPMorgan, Overweight, TP 260p; 10-Oct, Credit Suisse, Outperform, TP 220p; 9-Oct. Espirito Santo, Sell, TP 168p; 9-Oct, Nomura, Reduce (D), TP 180p; 29-Sept, Goldman Sachs, Neutral; 19-Aug, Morningstar, Hold; 11-Aug, Berenberg, Hold, TP 214p;
Source: Digital Look, Alpha Terminal, Bloomberg) (U = Upgrade / D = Downgrade; TP = Target Price)
———————————————————-
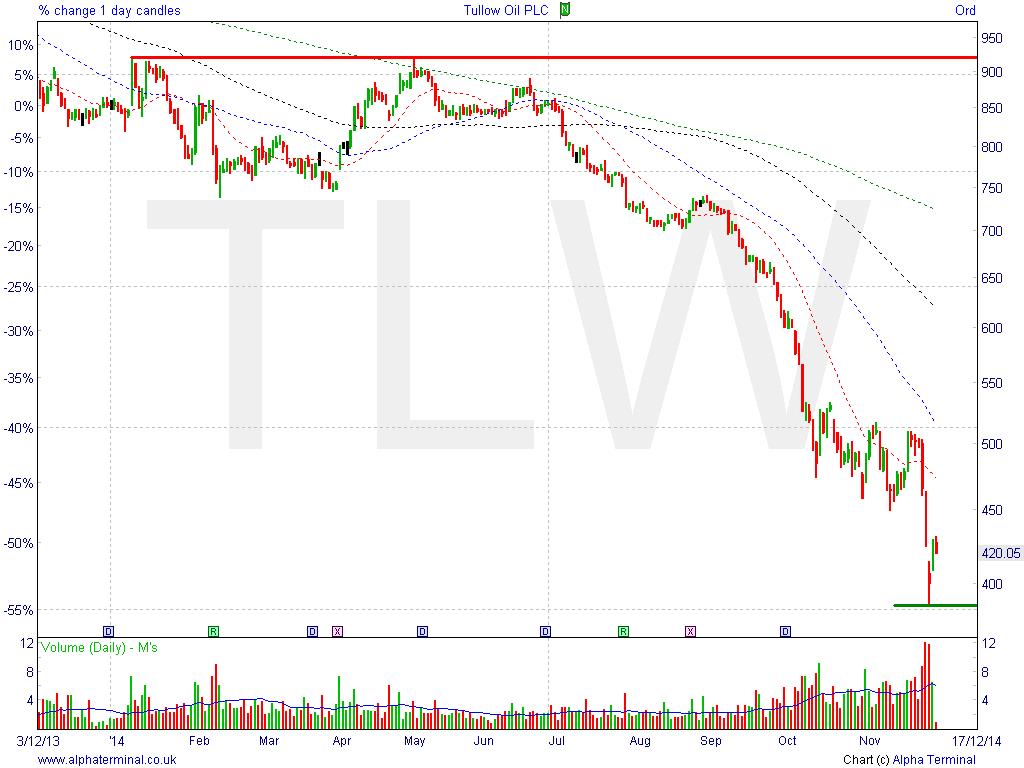
Tullow Oil (TLW) - Oil
1-month -12.6%, 3-month -42.1%, 12-month -50.9%
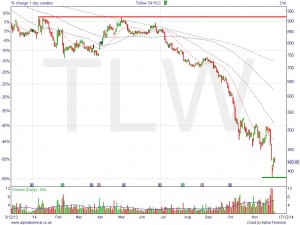
Source: AlphaTerminal; green and red lines indicate potential support and resistance
Will the price rise towards highs of 920p or will it fall towards lows of 385p?
Summary: Already in a downtrend, the shares have been hurt this year by a weak oil price, large capex projects becoming less viable and need for self-help and debt facility extensions. The company says shares are well below its downwardly revised Net Asset Value estimate (883p) and even its floor valuation (489p). An oil price recovery would likely help. Trading Update, 15 Jan; FY Results, 11 Feb
Technicals: In a downtrend since early 2012, the shares have given up over 75% from their 1620p highs and even fallen out of their falling 2yr channel. Despite a pause around 500p, another leg down was had lately as the oil price plunged. Can the shares be pumped higher or will they leak further?
Latest Broker 12-Month Consensus: 18 x Buy, 7 x Hold, 0 x Sell
2-Dec, Numis, Add, TP 491p (D); 1-Dec, JPMorgan, Neutral, TP 495p (D); Credit Suisse, Neutral, TP 715p; Deutsche, Hold; Westhouse, Buy, TP 770p; 25-Nov, SocGen, Buy, TP 580p; 21-Nov, Morningstar, Outperform; 18-Nov, Liberum, Buy, TP 720p; 12-Nov, Canaccord, Hold, TP 450p;
Source: Digital Look, Alpha Terminal, Bloomberg) (U = Upgrade / D = Downgrade; TP = Target Price)
———————————————————-
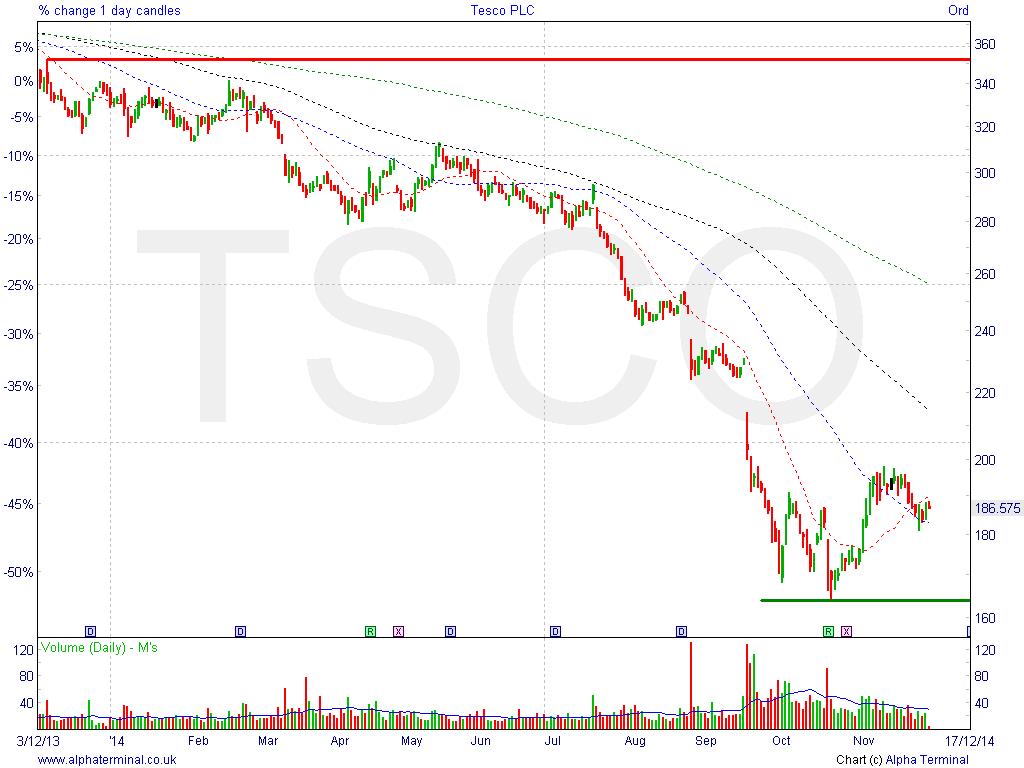
Tesco (TSCO) - Retail, Grocery
1-month 7.9%, 3-month -18.9%, 12-month -45.1%

Source: AlphaTerminal; green and red lines indicate potential support and resistance
Will the price rise towards highs of 350p or will it fall towards lows of 165p?
Summary: Shares have suffered from profits warnings linked to weak trading due to cut-price competition from smaller rivals gaining market share as well as internal accounting irregularities which cast a dark cloud over the whole sector for a while. While still the biggest grocer by market share, can TSCO start 2015 on the front foot? Interim Statement, 8 Jan; FY Results, 22 Apr
Technicals: In a downtrend since the beginning of the year, things have gone from bad to worse for TSCO taking the shares to near 11yr lows recently. Support kicked in 160-170p and we have almost tested 200p again. Worth adding to your basket for 2015? Or still a basket case?
Latest Broker 12-Month Consensus: 3 x Buy, 13 x Hold, 7 x Sell
3-Dec, Shore, Hold; 27-Nov, JPMorgan, Underweight, TP 145p; 19-Nov, Deutsche, Hold, TP 180p; 17-Nov, Goldman Sachs, Sell, TP 155p (D); 10-Nov, Charles Stanley, Hold; Sanford Bernstein, Outperform; 6-Nov, Citigroup, Neutral, TP 190p; 5-Nov, ExaneBNP, Neutral, TP 180p;
Source: Digital Look, Alpha Terminal, Bloomberg) (U = Upgrade / D = Downgrade; TP = Target Price)
———————————————————-
Rolls Royce (RR) - Industrials
1-month 1.7%, 3-month -16.8%, 12-month -29.4%
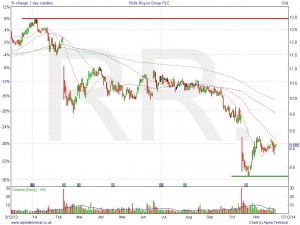
Source: AlphaTerminal; green and red lines indicate potential support and resistance
Will the price rise towards highs of 1295p or will it fall towards lows of 775p?
Summary: Dented by two profits warnings this year the shares have given up almost a third this year, the second shock coming only just recently as management predictions of 2015 growth were retracted due to rapid deterioration in economic conditions hurt energy and mining industries and the impact of Western sanctions on Russia feeds through. Preliminary Full year results, 13 Feb
Technicals: Another share showing a 2014 downtrend. Support emerged after the market downturn and the bounce shows appetite for the October gap-down to be filled. Can the shares be propelled higher to revisit mid-2014 levels of 1050p again? Or does this engine need an overhaul?
Latest Broker 12-Month Consensus: 10 x Buy, 13 x Hold, 4 x Sell
2-Dec, Panmure, Buy, TP 1310p; 28-Nov, Investec, Hold, TP 900p (U); 20-Nov, Westhouse, Neutral, TP 800p; 18-Nov, Credit Suisse, Underperform, TP 820p; 13-Nov, Liberum, Hold, TP 900p; 6-Nov, SocGen, Hold, TP 800p; 5-Nov, Cantor, Buy, TP 1310p; 3-Nov, Canaccord, Buy, TP 850p
Source: Digital Look, Alpha Terminal, Bloomberg) (U = Upgrade / D = Downgrade; TP = Target Price)
———————————————————-
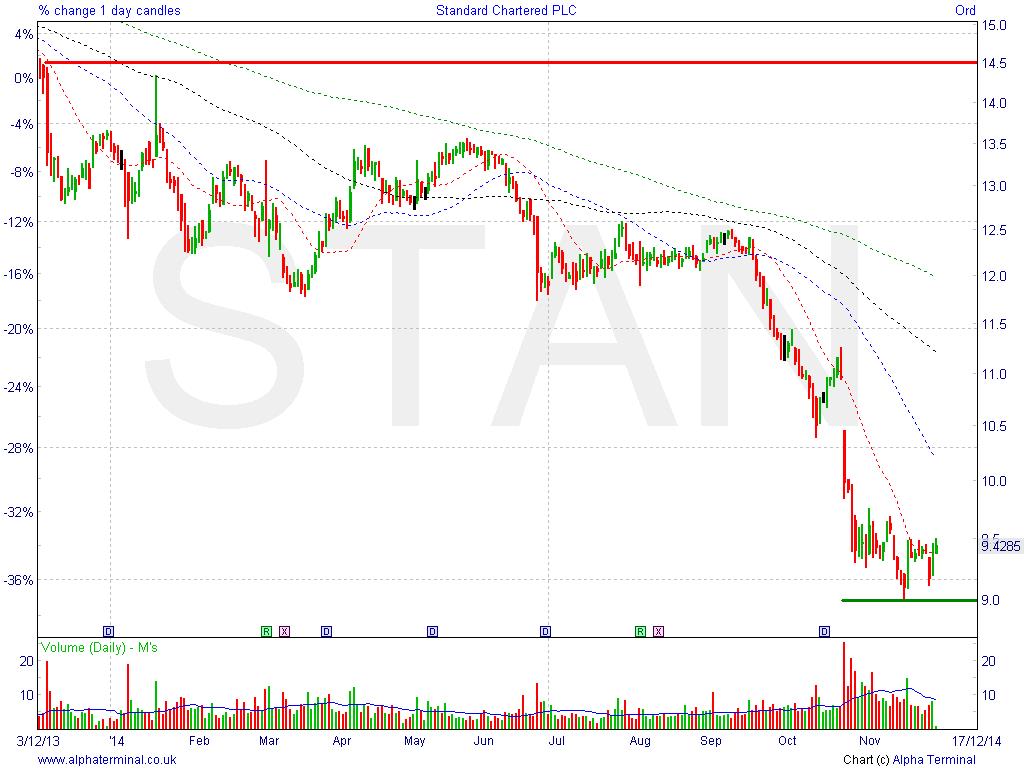
Standard Chartered (STAN) - Banks
1-month 0.1%, 3-month -22.8%, 12-month -34.6%
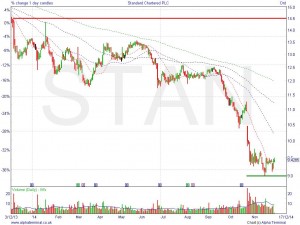
Source: AlphaTerminal; green and red lines indicate potential support and resistance
Will the price rise towards highs of 1450p or will it fall below lows of 900p?
Summary: Shareholders have had to endure unwelcome news about weaker profits and rising bad debts, as well as lacklustre strategy update. This follows a June profits warning and with doubts about strength rising over the years, some worry another rights issue is due. Not immune to ethical issues. Pre-Close statement, 4 Dec; Preliminary Full Year results, 5 Mar
Technicals: In a downtrend since early 2013, the shares have fallen over 50% from 1860p highs accelerating since the September market downturn and failing to register recoveries like other banking stocks. Recovery candidate via Asia focus? Or would it benefit from doing more closer to home?
Latest Broker 12-Month Consensus: 10 x Buy, 10 x Hold, 9 x Sell
3-Dec, JPMorgan, Neutral, TP 1250p; 2-Dec, Investec, Buy, TP 1250p; 27-Nov, Morgan Stanley, Underweight, TP 835p (D); 24-Nov, ExaneBNP, Underperform, TP 1000p; 17-Nov, Canaccord, Sell, TP 850p; 11-Nov, Shore, Buy; 6-Nov, Deutsche, Hold; 30-Oct SocGen, Hold, TP 1085p;
Source: Digital Look, Alpha Terminal, Bloomberg) (U = Upgrade / D = Downgrade; TP = Target Price)
———————————————————-
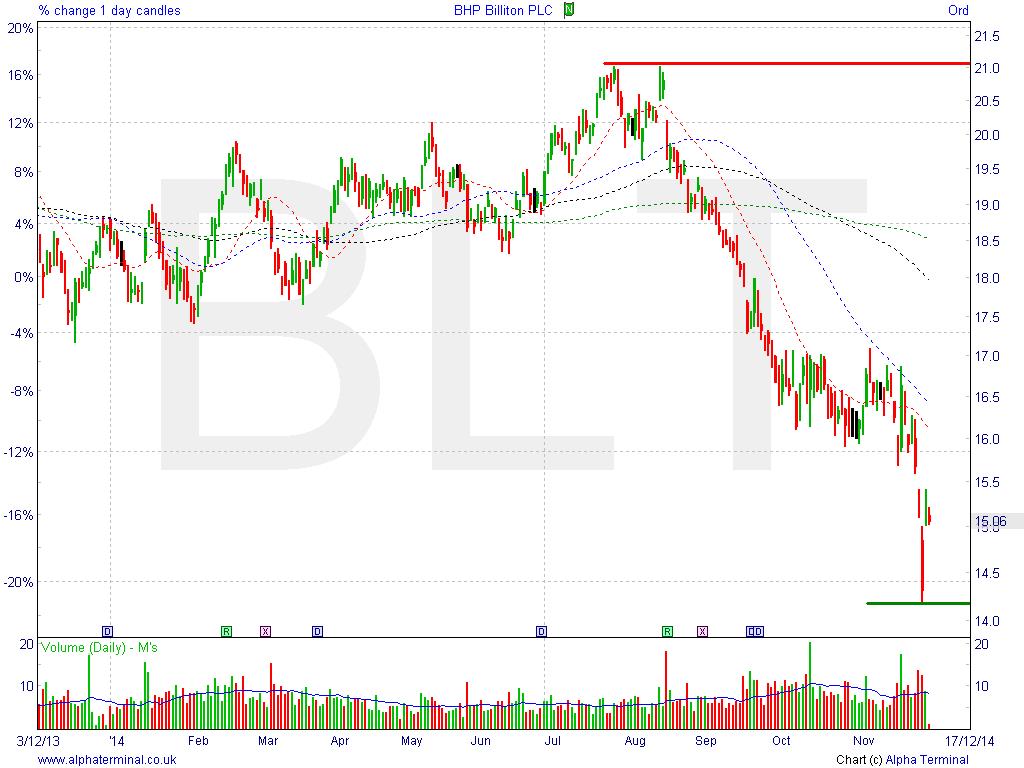
BHP Billiton (BLT) - Mining
1-month -5.9%, 3-month -21.0%, 12-month -16.8%
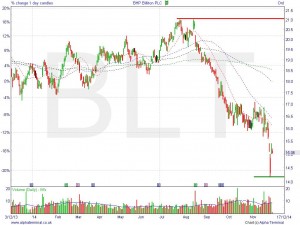
Source: AlphaTerminal; green and red lines indicate potential support and resistance
Will the price rise towards highs of 2110p or will it fall towards lows of 1420p?
Summary: Hampered by falling commodity prices, miners have been hurt by the prospect of slowing global growth as China begins to normalise after years of fast expansion and the Eurozone struggles to recover like the UK and US. A stronger USD via expectations of a US rate rise (and the end of QE) and a plunging oil price has made matters worse. Operational Reviews, 21 Jan and 22 Apr
Technicals: Sideways/gently rising for most of 2014, the shares began to correct in August, well before the market turned down. This can be linked to falling commodity prices on a stronger USD. Support kicked in around 5yr lows. Does the recent bounce have legs, or will the digging persist?
Latest Broker 12-Month Consensus: 12 x Buy, 12 x Hold, 1 x Sell
3-Dec, Deutsche, Buy TP 2400p; 1-Dec, Citigroup, Buy, TP 2050p (D); 28-Nov, Morgan Stanley, Overweight, TP 2200p (U); 25-Nov, UBS, Buy, TP 2100p; JPMorgan, Neutral, TP 2050p; 21-Nov, Liberum, Hold, TP 1850p; 13-Nov, Credit Suisse, Neutral, TP 2000p; 3-Nov, Nomura, Buy, TP 2300p
Source: Digital Look, Alpha Terminal, Bloomberg) (U = Upgrade / D = Downgrade; TP = Target Price)
———————————————————-