X

Get our occasional Market Report emails

sent straight to your inbox

There’s no charge for this.

Getting latest data loading
Home / Special Reports / The 12 Stocks of Christmas

This report is not a personal recommendation and does not take into account your personal circumstances or appetite for risk.

19 November 2017

The 12 Stocks of Christmas

With the New Year just around the corner, it’s time for traders to begin considering what 2018 has in store.

In our last publication (Santa Rally, 5 November) we highlighted the phenomenon of window dressing by some fund managers – the process of cutting underperforming stocks in order to make portfolios appear more attractive to prospective 2018 clients.

On the other side of the card, however, is the idea that managers attempt to identify undervalued stocks at the start of the new year in order to tap into their ‘recovery potential’ and register strong returns.

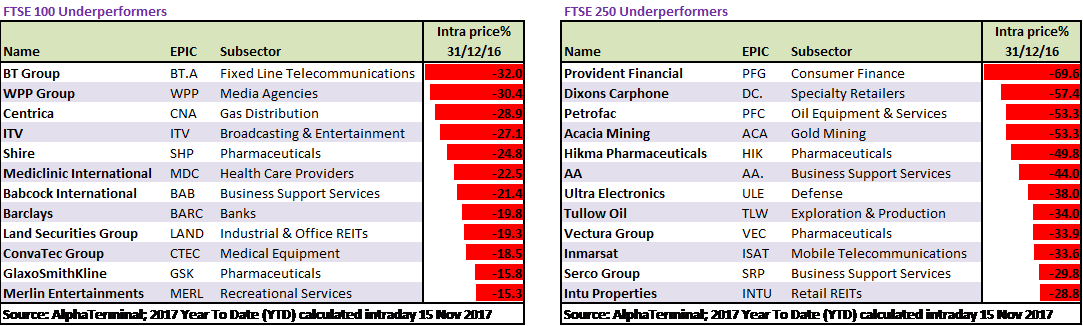
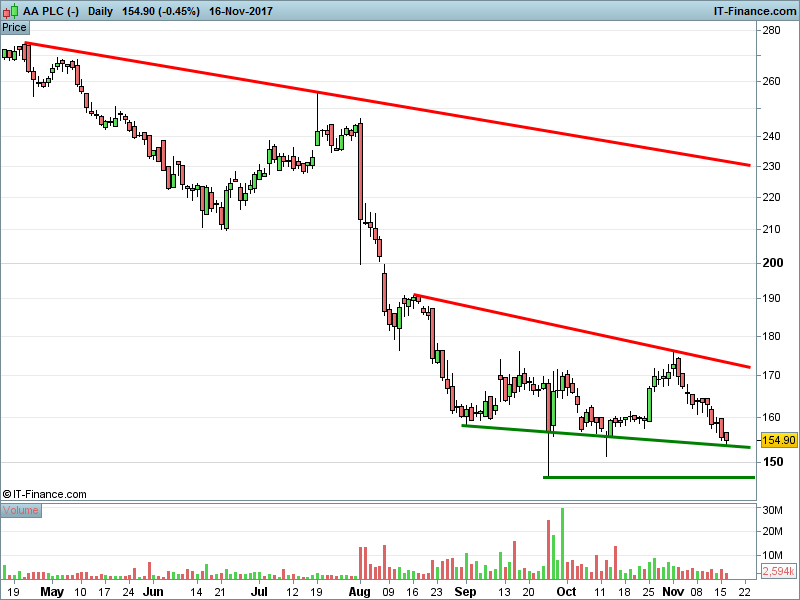
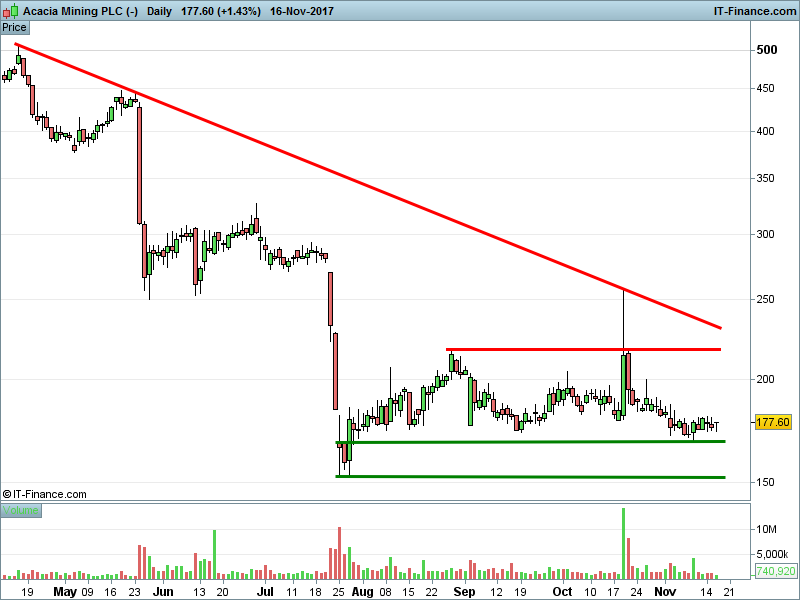
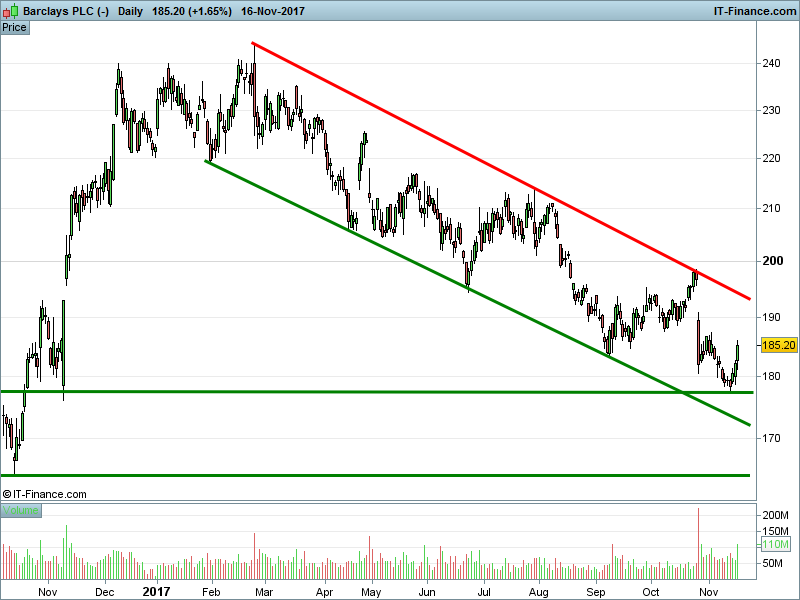
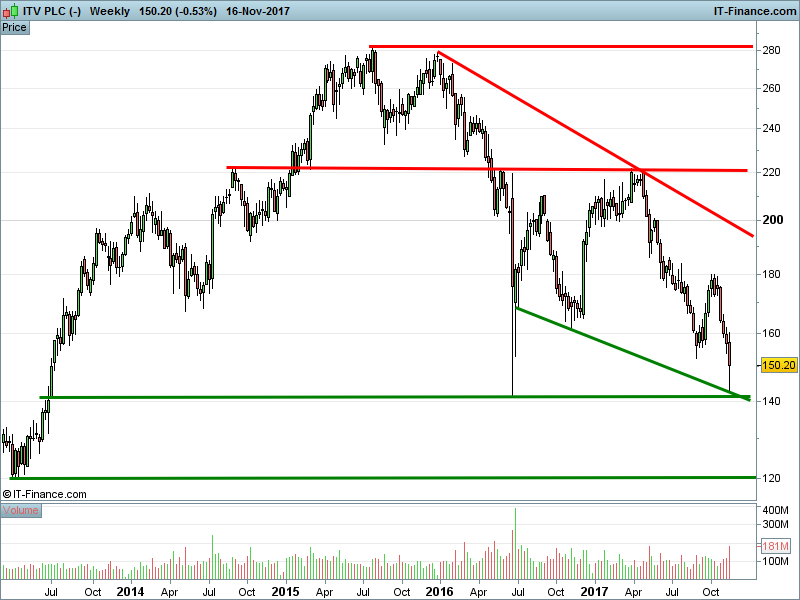
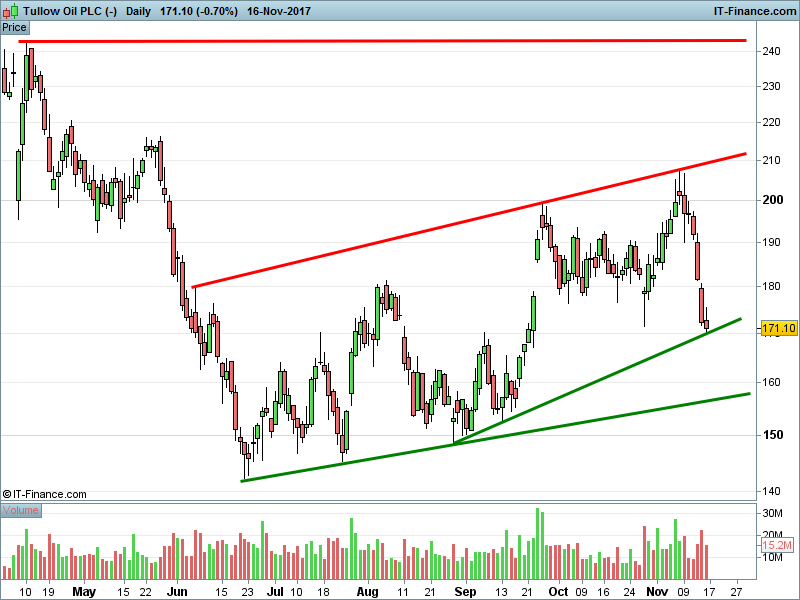
With that in mind, we’re analysing the 12 worst performing stocks on both the UK 100 and year-to-date (YTD) and assess which have the best recovery potential heading into 2018.

Why have these stocks been losers in 2017?

Whilst there are a multitude of factors that have caused these stocks to have such a torrid year, the high number of large cap stocks underperforming on the UK 100 and industry stalwarts on the 250 suggests a poignant change in demand patterns.

BT, the worst performing UK 100 stock this year, announced a shock profits warning early in 2017 after accounting malpractices in its Italian division. However, this underperformance has continued throughout 2017, seeing shares trade at 4-year lows.

On the , a different theme emerges.

The majority of stocks highlighted have suffered a string of profits warnings over the year, with the failure to restructure the business effectively causing companies to announce two or even three warnings.

Furthermore, the two worst performing stocks, Provident Financial and Dixons Carphone, were both UK 100 stocks at the start of the year. Dixons was the first to leave, being demoted after failing to recover following June 2016’s Brexit vote, while Provident saw multiple profits warnings wipe almost 80% from the company’s market capitalisation.

Are these stocks set to recover in 2018?

There are several reasons that some of the worst performing UK 100 and 250 stocks could see a share price recovery over the next 12 months.

In the case of the UK 100 , many of the names languishing at the bottom of the performance tables are multi-billion pound stalwarts of the UK market.

A slow reaction to changing market trends in key areas of their industries has culminated in share prices performing poorly over the course of the year.

However, many of these companies have historically delivered a high dividend to maintain interest in the company’s shares despite relatively uninteresting share price movements in the long run.

While their share prices may have turned south, the universal and long-standing appeal of these dividend payments means they have been protected on the most part by the companies to maintain interest.

Can these companies put the plight of 2017 firmly behind them to start the new year on the front foot?

Page: 01

The tables below show the 12 worst performers from both the UK 100 and .

The first, and perhaps easiest observation to make, is that 10 of the 12 underperformers have fallen by more than the biggest UK 100 underperformer. Why would this be?

The smaller market capitalisation of the stocks makes them more susceptible to big swings in share prices, with lower daily trading volumes also contributing to the greater volatility in these stocks. With that said, as mentioned earlier the two top underperformers were both UK 100 stocks earlier in 2017, while Hikma Pharmaceuticals and Intu Properties were both components of the blue-chip index at the start of the year.

Interestingly, a number of these stocks hail from similar sectors. Petrofac, Acacia Mining and Tullow Oil are all commodity producers, although they have under-performed for different reasons. Acacia faced an export ban in its key market, Petrofac was subject to an investigation into corruption and Tullow underwent a rights issue.

When looking at the UK 100 , it’s interesting to note the plethora of very large-cap stocks making up the list. Companies such as BT and WPP have market caps of several billion pounds Sterling and have been constituents of the UK 100 for decades. Furthermore, it’s interesting to note WPP traded an all-time high early in 2017 before the company’s share price fall 7.9% during a single session in March after a profits warning. However, BT maintains the fifth largest dividend yield on the index at 6%, while Centrica has the second largest at 7.25%.

Whilst commodity producers underperformed on the , the sector that has clearly underperformed on the blue-chip index is the Pharmaceutical sector.  Shire is the notable underperformer, struggling to overcome concerns that its product pipeline is not as promising as it once was, while GlaxoSmithKline has faced a similar issue. UK Index newcomers Mediclinic International and ConvaTec both hail from the Medical sector, and have both suffered as results disappointed investors, despite the former rallying 17.5% during a single session in April.

Finally, it’s also worth noting that UK 100 are not immune to issuing profits and sales warnings, with ITV and Merlin Entertainments both having issued the latter kind.

From the preceding 24 stocks, we’ve chosen our five favourites to analyse further. On the following pages, we delve deeper into the technical signals each are exhibiting, as well as providing a breakdown of the broker recommendations currently available. Which stocks could see a 2018 recovery and which have further to fall?

Page: 02

AA (AA.)

Will  AA return to Summer highs of 256p (+65%) or fall to September lows of 147p (-5.0%)?
  • The breakdown cover specialist’s shares have suffered this year as its Chairman left in contempt
  • Relative Strength Index (RSI) retreating towards oversold while Stochastics remains at that level
  • Momentum negative and at lowest level since September, while Directional Indicators level out
  • Brokers are positively-biased, with two thirds holding a 12-month price target above the current level
Broker Consensus: 63% Buy, 12% Hold, 25% Sell

Bullish: Morgan Stanley, Overweight, Target 285p, +84% (26 Sept)

Average Target: 225p, +45% (17 Nov)

Bearish: Jefferies, Underperform, Target 125p, -19% (27 Sept)


Pricing data sourced from Bloomberg on 17 November. Please contact us for a full, up to date rundown.

Page: 03

Acacia Mining (ACA)

Will  Acacia return to October highs of 260p (+46%) or fall to 2017 lows of 150p (-15%)?
  • Acacia shares have stabilised after their Tanzanian export ban was lifted. Recovery potential?
  • RSI remains without driver in neutral territory, while Stochastics have recovered from oversold
  • Momentum hovers around zero, while Directional Indicators positive
  • Brokers are positively-biased, with over 80% holding a 12-month price target above the current level
Broker Consensus: 11% Buy, 72% Hold, 17% Sell

Bullish: Numis Securities, Buy, Target 400p, +125% (30 Oct)

Average Target: 215.8p, +22% (17 Nov)

BearishPanmure Gordon, Sell, Target 147p, -17% (27 Oct)


Pricing data sourced from Bloomberg on 17 November. Please contact us for a full, up to date rundown.

Page: 04

Barclays (BARC)

Will  Barclays return to July highs of 214p (+16%) or fall to October 2016 lows of 164p (-11%)?
  • Shares are rallying from intersecting support at 177p. Will they rally to the channel ceiling?
  • RSI struggles to overcome 50 mark, although Stochastics have recovered sharply from overbought
  • Momentum turned positive for first time since October as Directional Indicators converge bullishly
  • Brokers are positively-biased, with 75% forecasting a 12-month price target above the current level
Broker Consensus: 48% Buy, 32% Hold, 20% Sell

Bullish: AlphaValue, Buy, Target 262p, +41% (31 Oct)

Average Target: 209.75p, +13% (17 Nov)

BearishDay by Day, Sell, Target 142.2p, -23% (15 Nov)


Pricing data sourced from Bloomberg on 17 November. Please contact us for a full, up to date rundown.

Page: 05

ITV (ITV)

Will  ITV return to 2017 highs of 220p (+46%) or fall to 2013 lows of 120p (-20%)?
  • Shares are recovering from intersecting support around 140p. Will they return to 2017 highs?
  • RSI turned oversold for first time since August, while Stochastics have recovered from overbought
  • Momentum remains negative but off worst levels, however Directional Indicators diverging bearishly
  • Brokers are positively-biased, with 85% holding a 12-month price target above the current level
Broker Consensus: 56% Buy, 35% Hold, 9% Sell

Bullish: Liberum, Buy, Target 330p, +119% (13 Nov)

Average Target: 202.2p, +35% (17 Nov)

BearishMacquarie, Underperform, Target 110p, -27% (2 Nov)


Pricing data sourced from Bloomberg on 17 November. Please contact us for a full, up to date rundown.

Page: 06

Tullow Oil (TLW)

Will Tullow return to April highs of 243p (+42%) or fall to June lows of 142p (-17%)?
  • Shares have found two rising lows support levels, however failed to overcome intersecting resistance
  • RSI have made a bearish cross the 50 mark, while Stochastics have turned overbought
  • Momentum at lowest level since August, while Directional Indicators diverging bearishly
  • Brokers are positively-biased, with over 75% holding a 12-month price target above the current level
Broker Consensus: 37% Buy, 48% Hold, 15% Sell

Bullish: Whitman Howard, Buy, Target 253p, +48% (17 Nov)

Average Target: 205p, +20% (17 Nov)

BearishTudor Pickering, Hold, Target 150p, -12% (24 Oct)


Pricing data sourced from Bloomberg on 17 November. Please contact us for a full, up to date rundown.

Page: 07

Want to take advantage of the above opportunities right now?

Whether you see UK Stocks going up or down for the remainder of the year, tradable opportunities will present themselves regularly. We’re here to help you weed them out and capitalise on them. Accendo Markets can help you increase your profit potential with the use of leveraged instruments such as CFDs, a flexible alternative to traditional shares that is currently exempt from UK stamp duty.

CFDs: Like shares, but more flexible

Stockbroking Ticket

CFD Ticket

The example above shows how buying 1,450 shares in British Land @ £6.90 requires an outlay of around £10,000 plus commission (see left-hand box), while the same exposure via a CFD requires about £500 plus commission (see right-hand box). If a trader invests in British Land, one would assume they believe the share price is likely to move in their favour. After considering the ‘worst case scenario’ and assigning funds to cover it, the trader may conclude there’s little point in exposing the full £10,000 to the BLND shares - some of that capital could be put to good use elsewhere in the markets. (Source: IG, Prices indicative)

CFDs are leveraged instruments, but you don’t have to use the leverage

If you had, say, £10,000 to invest in the stock market, you could deposit that amount into a share dealing account and purchase shares in a company. You would pay commission to open the position, 0.5% in stamp duty and the full £10,000 will be tied up in your chosen shares with any profit or loss based on that exposure. The same £10,000 worth of exposure can be secured with a CFD for a fraction of the initial outlay thanks to leverage, with the risk and reward the same as if £10,000 worth of traditional shares were held. But should you not be interested in leverage, you can always treat CFDs like shares. Simply deposit £10,000 into a CFD trading account and take the equivalent CFD position which will tie up just £500 (note that overnight financing costs will still apply). The remaining £9,500 is not tied up, so you can use some of that to take advantage of another short-term opportunity elsewhere, or simply leave it on the account to support any losses. Best of all, using a CFD means you pay no stamp duty!

What’s your view?

Think shares will rise? Take a long position by buying CFDs (buy low, aiming to sell high). Think they’ll fall? Take a short position by selling CFDs (sell high, aiming to buy low). For a more detailed rundown of CFDs, their mechanics, associated costs and some trading scenarios download our ‘Comprehensive Guide to CFDs’ here.

Page: 08

The Accendo Markets Research Offering

Does your current broker’s morning report tell you all you need to know about yesterday’s news? If so, how is it offering you anything more than the plethora of information already available on the internet?

We’re proud that our morning editorial has become a hot commodity in the City, its content quoted daily by the journalists that are writing the news everyone else will be reading later in the day, if not the next. Our morning report tells you what’s driving the market at that moment and what to look out for in the day ahead.

If a company has reported earnings before the market opens, we’ll tell you why the shares are called to open up or down in relation to that announcement.

As well as the Morning Report, signing-up to Accendo Markets Research & Trade Ideas offers you the chance to receive the following publications:

  • Another Level: A selection of key level alerts on various stocks.
  • Index Focus: A selection of key level alerts on the major indices.
  • Trade Alerts: Trading ideas from our analysts. What do they think is likely to move?
  • Macro Calendar: Live market-moving data, breaking news as it happens
  • Week in Advance: A summary of next week’s key events. Is there a trading opportunity there for you?

To ensure you can act as quickly as possible, you’ll receive an email with a link to the latest publication as soon as it’s released. You can unsubscribe from these emails at any time.

Based on a wealth of experience, gained from both large and small institutions, our Research and Trade Ideas are produced in-house. Our team of dedicated professionals comprises both analysts and traders, drawing upon a wide range of resources and methodologies.

Our aim is to provide you with the manpower and expertise you need to help you clarify, interpret and capitalise on the ever-growing volume of market information.

The journalists don’t pay for it and neither do you, so why not give it a go? You’ve nothing to lose and perhaps a little more to gain… Subscribe Today!

Page: 09

AccendoFX

Free online quotes and Competitive exchange rates


Do you need to exchange currency? You could be being overcharged by thousands of pounds by your bank or bureau de change!

It’s now easier than ever to get bank-beating currency exchange rates that could save you thousands. For too long banks have dominated the FX market to the point where they will simply give you an exchange rate that may as well have been plucked from thin air. The current system is due an overhaul.

The foreign exchange market is always moving. On this premise, a new breed of Currency Exchange specialists is able to offer unparalleled services that will help you by constantly monitoring the market on your behalf. It’s now the norm for customers to expect the support of a knowledgeable and approachable account manager - your eyes and ears in the market - who’s always on hand to talk.

Download your free Currency Exchange Guide here to make sure you don’t make the mistake of accepting an inferior exchange rate.


This free guide will tell you:

  • Common mistakes to avoid
  • How to get preferential exchange rates
  • How to get your timing right

Whether you're an individual or a business, this guide could put thousands of pounds in your pocket. Be informed, don't lose out. Download your free guide here.


AccendoFX Ltd - 1 Alie Street, London, E1 8DE (UK) - AccendoFX Ltd. is registered with the Financial Conduct Authority (FCA) No. 671133 and HMRC No. 12798406. Registered in England and Wales No. 9269365.

Page: 10

This research is produced by Accendo Markets Limited. Research produced and disseminated by Accendo Markets is classified as non-independent research, and is therefore a marketing communication. This investment research has not been prepared in accordance with legal requirements designed to promote its independence and it is not subject to the prohibition on dealing ahead of the dissemination of investment research. This research does not constitute a personal recommendation or offer to enter into a transaction or an investment, and is produced and distributed for information purposes only.

Accendo Markets considers opinions and information contained within the research to be valid when published, and gives no warranty as to the investments referred to in this material. The income from the investments referred to may go down as well as up, and investors may realise losses on investments. The past performance of a particular investment is not necessarily a guide to its future performance. Prepared by Michael van Dulken, Head of Research

Spread bets and CFDs are complex instruments and come with a high risk of losing money rapidly due to leverage.
Spread bets and CFDs are complex instruments and come with a high risk of losing money rapidly due to leverage. 67% of retail investor accounts lose money when spread betting and/or trading CFDs with this provider. You should consider whether you understand how spread bets and CFDs work and whether you can afford to take the high risk of losing your money.
.