X

Get our occasional Market Report emails

sent straight to your inbox

There’s no charge for this.

Getting latest data loading
Home / Special Reports / Should you ‘Sell in May’?

This report is not a personal recommendation and does not take into account your personal circumstances or appetite for risk.

6 May 2018

Should you ‘Sell in May’?

“Sell in May, Go Away, Come back on St Leger’s Day”. We’ve all heard the stockbroker cliché and for many it has become an easy punching bag for disproving so-called “conventional wisdom” on financial markets seasonality.

Market watchers are divided into two camps, one of which believes there are clear seasonal patterns to financial markets and trading, while the other is convinced that the markets are too unpredictable to be subject to simple “folksy” rules. Both sides of the debate have logic behind their arguments.

We at Accendo Markets believe in looking beyond the simple patterns that support or disprove popular proverbs and, instead, prefer to examine and analyse actual market data to help ensure our clients are better informed and more savvy investors. We already discussed the “Sell in May” theory in a 2015 report, and believe it is time to update our analysis to take an even more nuanced look at UK 100 companies and determine whether our clients can benefit from any seasonal patterns in their trading/investing.

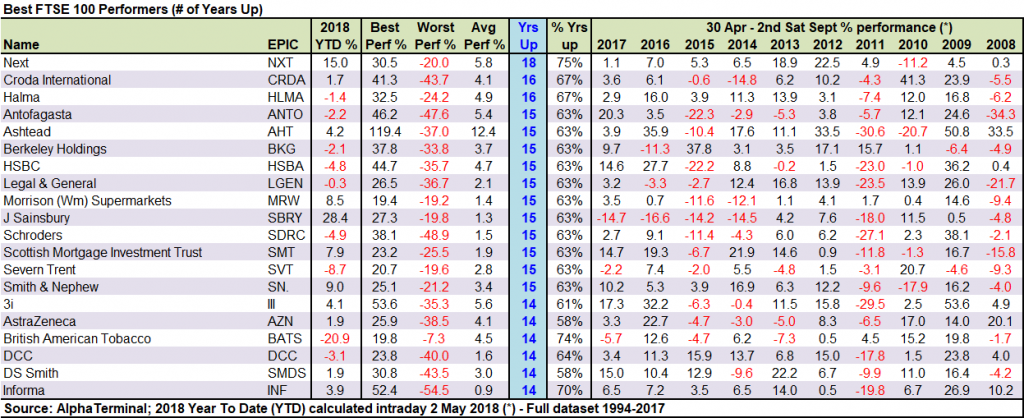
Here’s a small preview. During summer months, British American Tobacco shares rose 14 times in the last 24 years, a 74% positive rate, delivering +4.5% average share price growth.

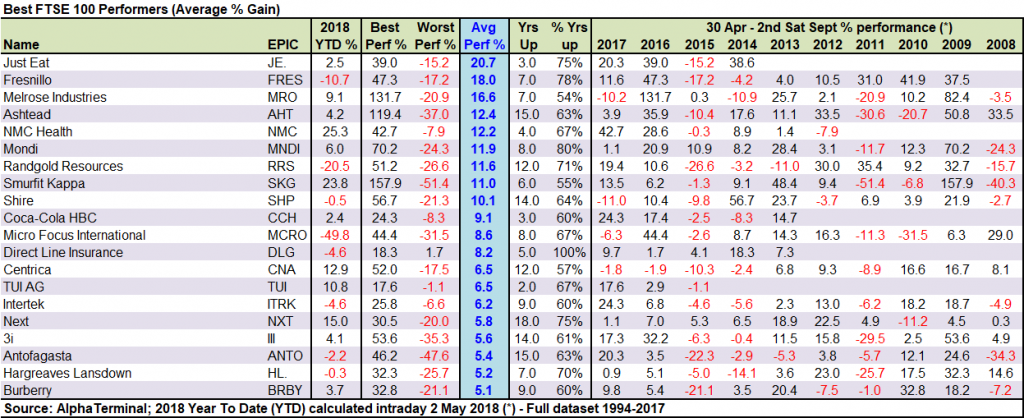
Relative newcomer to London Stock Exchange, Direct Line Insurance has traded publicly only 5 years, but it has seen its share price rise in every single summer period (+8.2% average share price growth). How’s that for seasonality?

Folk Wisdom

Just in case you have never come across the “Sell in May” adage, the theory goes like this. The St Leger Stakes is a prestigious horse race that takes place in at Doncaster, on St Leger’s Day, traditionally the second Saturday in September. Accordingly, the old saying is suggesting that investors should sell their holdings in May, be conservative with their investments during the summer and increase their activity in the second half of September.

There are many potential “reasons” for why the summer is a particularly disadvantageous period for investing. These include lower market volatility (which increases uncertainty and asset risk), lower general economic activity (e.g. lower company revenues and profits), and simply a lack of investor interest due to holidays.

However, for every simplistic reason to support the adage, there is an equally strong (albeit still simplistic) argument to counter it. If utility companies see less demand during the summer (we heat our homes less), retailers/restaurants/pubs should benefit from the good weather boosting consumer confidence.

Accendo Markets’ research team issues daily publications on indices, commodities and blue-chip equities. Read on to find out more about the companies that typically outperform and underperform during the summer period and sign up to have our research sent directly to your inbox.

Page: 01

Scoping the Market

At Accendo Markets we believe in looking beyond anecdotal evidence and examining actual market data to determine how the UK 100 performs during the summer, and if investors can use those statistics to identify suitable investment opportunities.

Whether the “Sell in May” saying has any basis in fact or not, the most useful approach for investors is to get actionable intelligence for actual performance of UK 100 stocks so that they can make informed decisions. In the end, the purpose of this report is not to support or disprove old sayings, rather to empower investors and give them the research tools that will enable them to successfully trade in any seasonal period.

With that in mind, we have examined price performance data for the summer period for each member of the UK 100 , from the benchmark index’s birth in 1994 through to September 2017.

To stay true to the “Sell in May, Go Away, Come back on St Leger’s Day” saying, we have selected a precise Target Period spanning April 30 through to the second Saturday in September of each year, 1994-2017

Data was collected on May 2, 2018, using Alpha Terminal platform, using historical data from the London Stock Exchange (LSE).

The following metrics have been derived from gathered price data:

  • Year-to-date (2018 YTD %) performance of the stock
  • Best performance (%) during Target Period
  • Worst performance (%) during Target Period
  • Average performance (%) during Target Period
  • Number of Years during Target Period when performance was positive or negative
  • Proportion of years (%) during Target Period when performance was positive or negative

Page: 02

Measuring Best & Worst UK 100 performers

What does our data set tell us? Which of the derived metrics is most useful in determining which stock typically performs well during the summer months, and which does poorly?

Every company has its ups and downs and judging a stock’s summertime performance by the worst and best year, or even just the last 3-5 years, can be dangerous. Those results could easily have been influenced by macroeconomic conditions (a Referendum perhaps?) as much as by the summer period itself.

The metrics most useful to investors include Average Share Price Performance as well as the Number of Years the share price delivered positive returns. In some cases, however, investors must beware of and consider that some companies have a limited trading history, having only been listed on the London Stock Exchange for a few years. A great summer performance hit rate can be flattered by just a few years’ worth of data.

As always, ranking companies by a single metric can obscure trends and a research-oriented investor needs to examine several factors to make a more balanced investing decision.

When all is said and done, how does the “Sell in May” theory correlate with actual pricing data? The table below showcases yearly performance (full dataset: 1994-2017) for the 20 UK 100 companies which have seen their share price increase the most years since 1994, during our May-to-September target period.


What is clear from the table is that the selection of the most reliable stocks (those whose shares repeatedly rally during the summer months) is not limited to any specific industry or sector. Retailer Next (18 positive summer performances out of 24), sits alongside Copper miner Antofagasta, banking giant HSBC and water utility Severn Trent (all 15). So much for the theory that utilities underperform in the summer, eh?

However, 24 years is a long time; some may only have done well many years ago, flattering their history. Apart from the absolute number of positive summer share price rises, we can also compare UK 100 constituents based on Average Performance during summer period.


What is striking in the above table is how different it is from the prior one. While the repeat performers who have rallied each summer in the previous 24 years are, by necessity, the old stalwarts of the LSE, the biggest performers, those whose share price has risen the most on average, feature many new and young faces.

The best performers on this list are companies such as online delivery service Just Eat (20.7% average stock price rise during our target period) and UAE-based healthcare chain NMC Health (12.2%), both of which have only been on the LSE for 4 and 6 years, respectively.

Other companies of note include Direct Line Insurance (average +8.2%), which has rallied in each of the 5 summer periods since its IPO, as well as Melrose Industries, which has rallied an astonishing 131.7% in summer 2016 (M&A), outperforming the likes of equipment rental outfit Ashtead (+35.9%), bottling company Coca-Cola HBC (+17,4%) and 3i (32.2%) in the same period.

The table also demonstrates the limitations of measuring average performance across a long period. Utility company Centrica shows an average 6.5% share price rise (up in 12 of 24 years), but in recent years it has underperformed during our target period, posting negative share price growth in 2014-17. To find Centrica’s best summer period, you need to go back all the way to summer 1997, when its share price (demerger from British Gas at the time) climbed 52% after is IPO.


On the flip side, some of the worst performing shares exhibit a high amount of volatility. Russian steel producer Evraz has seen its share price see-saw during the summer months between -29.5% (2012), +22.4% (2014), -63.7% (2016) and 42.9% (2017), resulting in an average summer performance of -6.6%.

With a 2018 year-to-date performance of +42.9%, Evraz’s share price movement has a greater correlation with economic factors such as the situation on the commodity markets and geopolitical concerns (i.e. steel tariffs, international trade sanctions), rather than seasonality on the London Stock Exchange.

For the full breakdown of these figures, or to discuss options with one of our traders, please contact [email protected] and we will call you back with the information requested.

Top Dogs

Besides looking at the average performance of UK 100 stocks, investors can also examine specific companies that stand out of the crowd. The purpose of this more detailed look is to put the select companies under a microscope and understand what separates stocks that typically overperform during the summer months from those that typically underperform.

These are not simply our “Summer Top Stock Picks”, rather a sample of three stocks from both ends of the summer performance spectrum, giving a more nuanced appreciation of where they currently trade, what sets them apart from their peers and what potential they may have over our target period.

Continue reading to find out more about three select companies that have typically overperformed during summer months, as well as three select companies which have typically underperformed.

Page: 03

Just Eat (JE)

A relative newcomer to the London Stock Exchange, online takeaway service Just East has been a solid summer performer ever since its 2014 IPO. Even though 2018 will only be company’s fifth year trading publicly, Just Eat has already been promoted to the UK 100 list as of November 2017.

Of the four full Target Periods (2014-2017) since Just Eat went public, the company has delivered positive performance in three of them, averaging a 20.7% stock price increase during the summer months, its best performance being in 2016 (+39%) and its worst in 2015 (-15.2%).

(Source: CMC Markets, Date: 02.05.2018)

  • The company’s 2018 year-to-date (YTD) performance currently stands at +2.5%
  • At present, Just Eat is trading in the middle of a range, below the mid-February highs of the year, but well above the lows of mid-April.
  • A longer-term uptrend sits within a rising channel with support around 670p and several resistance levels between 820-890p.
  • The question for investors is whether the stock will get above the 820p resistance, or if it will reverse back toward 700p?

Page: 04

Randgold Resources (RRS)

Miner Randgold Resources, which develops gold deposits in West and Central Africa, has been another stable May-to-September performer. Although the stock’s recent declines have disappointed bullishly-minded investors in 2018 (YTD -20.5%), it has tended to perform well during the summer months.

Since 2001, Randgold has delivered positive performance in 12 out of 17 years (2001-2017, 71% positive rate), with an average stock price increase of 11.6%. Its best performing May-to-September period was in 2002 when the shares rose over 51%, while its worst performing Target Period was in 2015 (-26.6%).

(Source: CMC Markets, Date: 02.05.2018)

  • With gold mining companies often seen by investors as an alternative to owning physical gold itself, the share price of Randgold has often reflected general sentiment for precious metals
  • Despite starting the year on a positive note and reporting record output, Randgold’s share price has suffered amid concerns regarding geopolitical stability in Africa
  • In April, Randgold’s stock traded a low of the year, which could mean support now around 5571p
  • Investors need to decide if the stock will continue underperforming due to political worries, or whether the resilience of the gold market will push the stock up over 6000p resistance

Page: 05

Shire (SHP)

Shire is a leading global biopharmaceutical company that has carved itself a niche in rare diseases. Headquartered in Dublin, Shire has become a lucrative target for major takeover efforts from several international biotech companies, including US-based AbbVie in 2014 and currently Takeda (Japan), which has offered £49/share. Recent share price performance of Shire reflects these M&A efforts, with the stock rising in March and April on news of potential takeover offers. With Takeda’s merger offer still on the table and formally presented to Shire’s Board of Directors, much of the share price action during the summer will be driven by market reactions to the takeover outcome.

Shire has been listed on the LSE since 1996 (Top 20 UK 100 contributor) and its share price has seen positive performance in 14 of the last 22 years (1996-2017, 64% positive rate).

Its best performing May-to-September period was in 2014, when the share price gained 56.7% over the summer months, while its worst performing year was 1998 (-21.3%). With the stock currently trading just off 2018 highs of 4000p, the question for investors is whether a Shire/Takeda deal will push the share price above 4200p highs, or whether it will fall back to pre-offer levels of 3000p?

Source: CMC Markets, Date: 02.05.2018

Page: 06

At the other end of the spectrum are three companies that have tended to underperform May to September.

Taylor Wimpey (TW)


Source: CMC Markets, Date: 02.05.2018

Housebuilder Taylor Wimpey has been a stable fixture of the London Stock Exchange for decades, going back to before the 2007 merger of Taylor Woodrow and George Wimpey. Promoted to the UK 100 index in 2014, Taylor Wimpey has had its share of ups and downs through the years. Ove the full 24-year period examined in this report, Taylor Wimpey has seen its share price decline 14 times (42% positive rate), with an average share price loss of 6% May to September, its worst performing period being the summer of 2008 (-58%), at the heights of the US sub-prime collapse and the early days of the financial crisis.

Taylor Wimpey shares have so far lost 7% of their value in 2018 (YTD), but have found potential support around 180p. Will the share price continue rising past long-term support-turned resistance at 195p, or will the current share price rally turn into a bearish double top pattern reversing the shares back to 180p this summer?

Page: 07

Royal Mail (RMG)

Source: CMC Markets, Date: 02.05.2018

Royal Mail has been a household name in the United Kingdom for centuries, most of the time serving as a public postal service. The company has been publicly listed on the London Stock Exchange and a member of UK 100 since 2014. It briefly left the index in 2017 after a summer share price crash, but has since been promoted back as the shares recovered.

Overall, Royal Mail stock price has seen significant volatility during the May-September season, falling in two out of the four Target Periods since its IPO, with an average share price loss of nearly 5%.

The company’s share price movement has been very bullish in 2018, with year-to-date gains of 30%. Technical indicators suggest that the shares are trading in a long-term rising channel (going as far back as late 2017). Keeping in mind its poor performance over the previous summer periods, can this rising channel be sustained after May? Or will the share price retrace back to its starting point last year?

Page: 08

Barclays (BARC)

Source: CMC Markets, Date: 02.05.2018

Barclays is a major banking institution and a staple of the UK financial system (another Top 20 UK 100 contributor by percentage weighting and a Top 50 by market capitalisation).

Despite its long and storied history on the London Stock Exchange, its performance record during the summer Target Period has been less than stellar. During the twenty-four years examined in this dataset (1994-2017), Barclays share price has declined in half of the summertime periods, with an average share price loss of 2.7% . Its largest summer decline has been recorded in 2011 (-49%), while the biggest gain was in 2009 (+31.5%).

Despite its share price inconsistency during the summer period, Barclays share price has been steadily rising since November 2017, though its 2018 year-to-date performance has been more muted (+0.8%). Currently Barclays is off its 220p highs of the year, trading between support at 205p and resistance at 217p.

The question for investors is whether Barclays shares will deliver a bullish breakout, or will the share price repeat last summer’s drop (-11% during target summer period) and fall out of the rising channel?

Page: 09

Want to take advantage of the above opportunities right now?

Whether you see UK Stocks going up or down for the remainder of the year, tradable opportunities will present themselves regularly. We’re here to help you weed them out and capitalise on them. Accendo Markets can help you increase your profit potential with the use of leveraged instruments such as CFDs, a flexible alternative to traditional shares that is currently exempt from UK stamp duty.

CFDs: Like shares, but more flexible

While buying 14,182 shares in Lloyds Banking @ 70.51p requires an outlay of around £10,000 plus commission, the same exposure via a CFD requires about £500 plus commission (see right-hand box; margin + costs). If a trader invests in Lloyds Banking, one would assume they believe the share price is likely to move in their favour. After considering the ‘worst case scenario’ and assigning funds to cover it, the trader may conclude there’s little point in exposing the full £10,000 to Lloyds Banking shares - some of that capital could be put to good use elsewhere in the markets. (Source: CMC, Prices indicative)

CFDs are leveraged instruments, but you don’t have to use leverage

If you had, say, £10,000 to invest in the stock market, you could deposit that amount into a share dealing account and purchase shares in a company. You would pay commission to open the position, 0.5% in stamp duty and the full £10,000 will be tied up in your chosen shares with any profit or loss based on that exposure. The same £10,000 worth of exposure can be secured with a CFD for a fraction of the initial outlay thanks to leverage, with the risk and reward the same as if £10,000 worth of traditional shares were held. But should you not be interested in leverage, you can always treat CFDs like shares. Simply deposit £10,000 into a CFD trading account and take the equivalent CFD position which will tie up as little as 3%/£300 (note that overnight financing costs will still apply). The remaining £9,700 is not tied up, so you can use some of that to take advantage of another short-term opportunity elsewhere, or simply leave it on the account to support any losses. Best of all, using a CFD means you pay no stamp duty!

What’s your view?

Think shares will rise? Take a long position by buying CFDs (buy low, aiming to sell high). Think they’ll fall? Take a short position by selling CFDs (sell high, aiming to buy low). For a more detailed rundown of CFDs, their mechanics, associated costs and some trading scenarios download our ‘Comprehensive Guide to CFDs’ here.

Page: 10

The Accendo Markets Research Offering

Does your current broker’s morning report tell you all you need to know about yesterday’s news? If so, how is it offering you anything more than the plethora of information already available on the internet?

We’re proud that our morning editorial has become a hot commodity in the City, its content quoted daily by the journalists that are writing the news everyone else will be reading later in the day, if not the next. Our morning report tells you what’s driving the market at that moment and what to look out for in the day ahead.

If a company has reported earnings before the market opens, we’ll tell you why the shares are called to open up or down in relation to that announcement.

As well as the Morning Report, signing-up to Accendo Markets Research & Trade Ideas offers you the chance to receive the following publications:

  • Another Level: A selection of key level alerts on various stocks.
  • Index Focus: A selection of key level alerts on the major indices.
  • Trade Alerts: Trading ideas from our analysts. What do they think is likely to move?
  • Macro Calendar: Live market-moving data, breaking news as it happens
  • Week in Advance: A summary of next week’s key events. Is there a trading opportunity there for you?

To ensure you can act as quickly as possible, you’ll receive an email with a link to the latest publication as soon as it’s released. You can unsubscribe from these emails at any time.

Based on a wealth of experience, gained from both large and small institutions, our Research and Trade Ideas are produced in-house. Our team of dedicated professionals comprises both analysts and traders, drawing upon a wide range of resources and methodologies.

Our aim is to provide you with the manpower and expertise you need to help you clarify, interpret and capitalise on the ever-growing volume of market information.

The journalists don’t pay for it and neither do you, so why not give it a go? You’ve nothing to lose and perhaps a little more to gain…

Page: 11

Free online quotes and Competitive exchange rates »

Do you need to exchange currency? You could be being overcharged by thousands of pounds by your bank or bureau de change!

It’s now easier than ever to get bank-beating currency exchange rates that could save you thousands. For too long banks have dominated the FX market to the point where they will simply give you an exchange rate that may as well have been plucked from thin air. The current system is due an overhaul.

The foreign exchange market is always moving. On this premise, a new breed of Currency Exchange specialists is able to offer unparalleled services that will help you by constantly monitoring the market on your behalf. It’s now the norm for customers to expect the support of a knowledgeable and approachable account manager - your eyes and ears in the market - who’s always on hand to talk.

Quite simply, you can get commission free currency exchange at bank-beating rates and free onward transfer to your destination of choice.

Sound too good to be true? To find out how you can get better currency exchange rates and a better service for less register with Accendo FX today.

Personal and Business Account Features

Free to open

Bank-beating exchange rates

No transfer fees

Dedicated currency trader to assist you

Expert research and guidance

Page: 12

This research is produced by Accendo Markets Limited. Research produced and disseminated by Accendo Markets is classified as non-independent research, and is therefore a marketing communication. This investment research has not been prepared in accordance with legal requirements designed to promote its independence and it is not subject to the prohibition on dealing ahead of the dissemination of investment research. This research does not constitute a personal recommendation or offer to enter into a transaction or an investment, and is produced and distributed for information purposes only.

Accendo Markets considers opinions and information contained within the research to be valid when published, and gives no warranty as to the investments referred to in this material. The income from the investments referred to may go down as well as up, and investors may realise losses on investments. The past performance of a particular investment is not necessarily a guide to its future performance. Prepared by Michael van Dulken, Head of Research

Spread bets and CFDs are complex instruments and come with a high risk of losing money rapidly due to leverage.
Spread bets and CFDs are complex instruments and come with a high risk of losing money rapidly due to leverage. 67% of retail investor accounts lose money when spread betting and/or trading CFDs with this provider. You should consider whether you understand how spread bets and CFDs work and whether you can afford to take the high risk of losing your money.
.