X

Get our occasional Market Report emails

sent straight to your inbox

There’s no charge for this.

Getting latest data loading
Home / Special Reports / Sector Focus: Oil & Gas

This report is not a personal recommendation and does not take into account your personal circumstances or appetite for risk.

16 March 2015

Sector Focus: Oil & Gas

Today there are around 15 oil & gas companies listed on the London Stock Exchange - ranging from Blue Chip giants like BP and Royal dutch Shell to Small Cap movers & shakers like Afren -  whose revenuesdepend directly on finding reservoirs, drilling wells and extracting crude oil to sell on to refineries. Withcrude oil in particular being an important and current topic of interest, traders armed with the right information and industry knowledge can make good returns on their investments.With crude prices in an albeit tenuous uptrend following several months of damaging deflation, is now the right time to buy into oil & gas stocks? Would it be better, perhaps, to attempt to profit from further declines? One thing's for sure - trading opportunities will present themselves.Investing in Oil & Gas can be complicated. The sector is pervaded by buzz words and terminology that can scare investors new to trading energy stocks, and that is why in this special report from Accendo Markets we aim to part the clouds so that you'll have the information you need to trade UK Index and AIM listed Oil & Gas shares. We are going to tell you what all those confusing terms mean, what drives the industry and who we believe you should be paying attention to as we move deeper into 2015.

Tullow Oil (TLW)

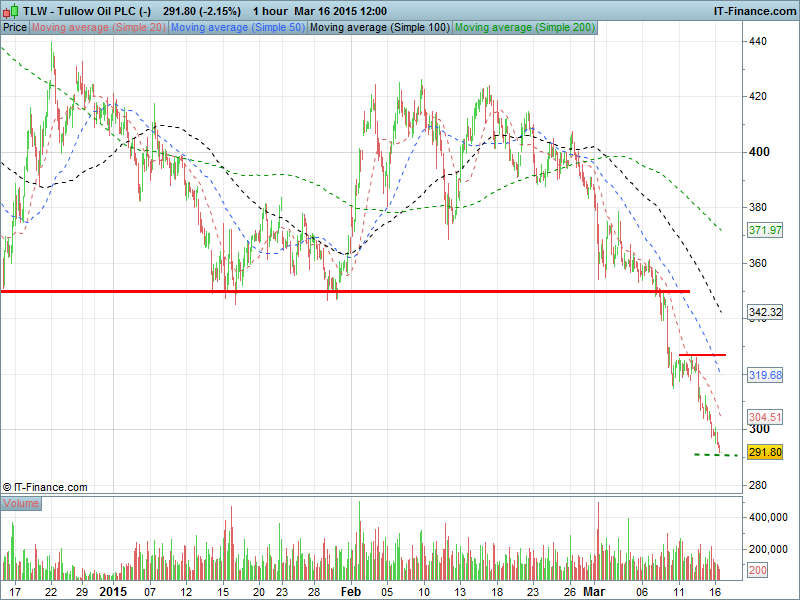
Tullow Oil PLC (-)

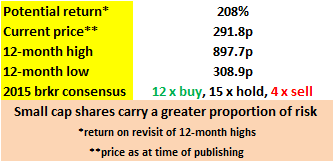
TLW table

Following a dire start to 2015 in which the troubled E&P firm has faced relegation from the UK 100  and seen its share price continue south to trade down a massive 25% since the beginning of the year, Tullow Oil (TLW) released on Wednesday what it called ‘excellent’ appraisal results from the South Lokichar basin in Kenya and sees strong growth in production from the region coming in the next 18 – 24 months.

The two ‘appraisal wells’ have tested in excess of 11,500 barrels of oil (bbl) per day , and with promising seismic data indicating extended reserves in the vicinity of the test wells, could we be about to see a reversal of fortunes and a return to blue chip status for Tullow?

Or did Tullow simply get lucky with the two wells in the South Lokichar Basin? With a separate exploration well turning out to be dry, have the positives been exaggerated in a desperate attempt to try to boost investor confidence?

Premier Oil (PMO)

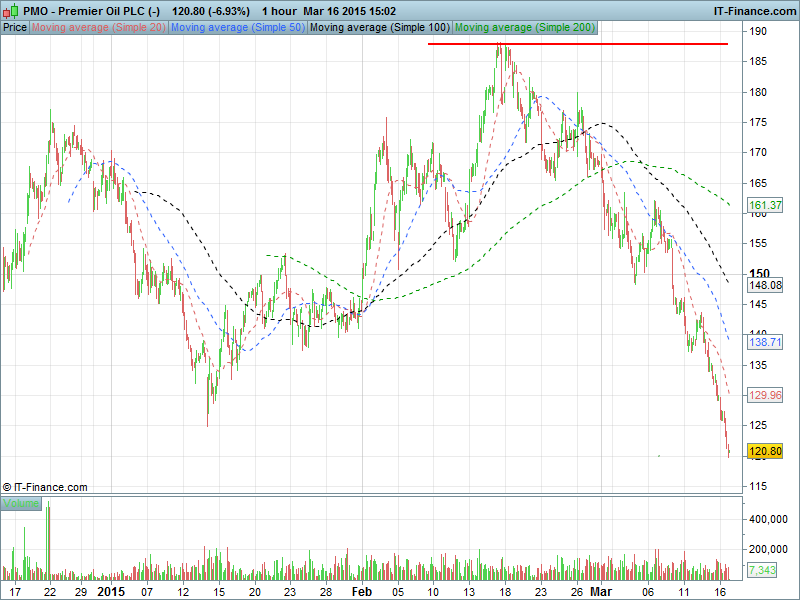
Premier Oil PLC (-)

PMO table

Another oil company that took a beating from the collapse in crude prices initiated last summer, Premier Oil scrapped its 2014 dividend payment in February after sinking into debt after booking $328m in impairment charges on some of its oil and gas assets.

Premier, whose operations stretch from the Falklands to Indonesia, reported an FY 2014 $210m loss that put shares into a volatile falling channel that has continued into March.

There may be light on the horizon, however, following the announcement that production has started on a second site offshore in Indonesia called the Pelikan field, and on budget to boot. This suggests good management in bringing the project on stream. Operational flexibility and ability to meet growing demand in Singapore are likely to be increased with the delivery of the new fields and the company expects to be able to respond to increased domestic gas demand too.

Will the demand arise? Will oil prices rise?! Will Premier Oil clamber out of debt and make itself attractiveto investors again by re-starting dividend payments?

Gulf Keystone Petroleum (GKP)

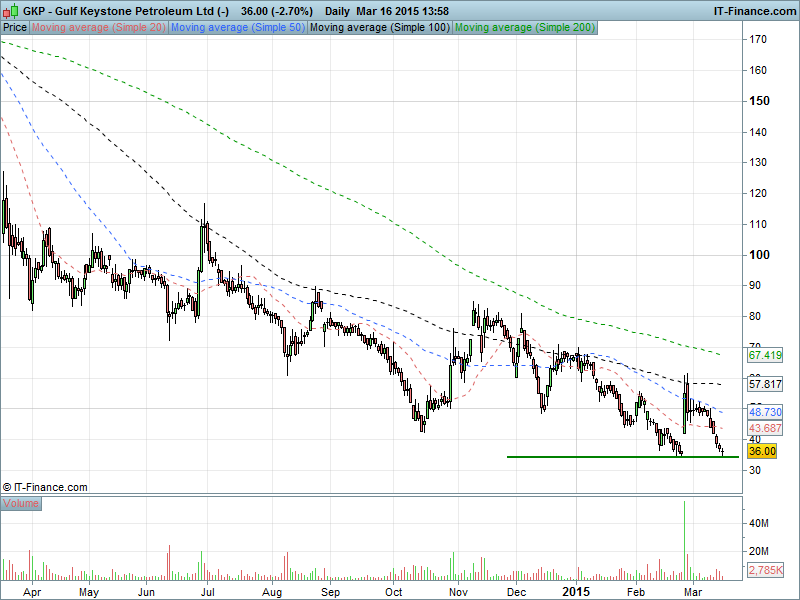
Gulf Keystone Petroleum Ltd (-)

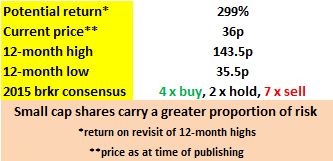
GKP table

In 2014 GKP found itself caught in a standoff between Kurdistan’s semi-autonomous government and that of Iraq that left the oil producer blacklisted by the latterunpaid for tens of millions of barrels already extracted for export and quite frankly in a situation every bit as sticky as the crude itself. Shares plungedby 30% between March and October, when withheld funds finally began to trickle out and GKP began to get paid - GKP is now diverting oil sales to the local market, where it gets less per barrel but income nonetheless.

Fast forward to this week; shares have recovered 24% from their October lows and have had a good 2015 so far as investors pile in ahead of a potential takeover bid. Indeed, on the day the news of a possible takeover came out, shares began trading 20% up from the previous day’s close. With volatile trading channels linking the major highs and lows making for adventurous trading opportunities, broker consensus torn between ‘strong buy’ and ‘strong sell’ and that 20% gap yet to be closed, where next for GKP?

Your Oil & Gas Primer: Production & Reserves

Exploration and production (E&P) companies search out reservoirs of oil, drill wells and extract crude oil which is then sold on to refineries. E&P activity is known as ‘upstream’ and there are over 100 of these companies listed on London’s UK Index and AIM indices. Nearly all revenues are directly associated withOil & Gas production, so it’s useful to develop a basic understanding of production terminology that you can use to assess these stocks.

You’re no doubt aware that when people talk about oil, the word ‘barrels’ crops up. Oil production is always described in terms of barrels (bbl) per day, where 1 barrel is just shy of 159 litres. It is common for production to be in the thousands  of bbl per day and the suffix ‘m‘ is used to denote this. So 1000 bbl becomes mbbl and 1000,000 bbl becomes mmbbl. When a company reports production of 3 mmbbl per day, that means 3 million barrels (numbers chosen randomly).

Another popular unit of production is ‘barrels of oil equivalent’ (boe), used by producers of both oil and gas to report combined production. It is not necessary to go into the small details here, but suffice to say that the calculations are based on the energy contained in the commodities. One barrel of oil has the same amount of energy contained within it as 171 cubic metres of gas, so that every 171 cubic metres of gas produced is equal to 1 barrel of oil equivalent.

It’s important to understand this terminology, since in the course of your research you will encounter it often. While reserves’ values are not directly logged in a company’s financial statements, they are often used by investors to value E&P companies and ascertain their potential for future growth.

E&P companies focus on the bare bones – finding and extracting oil and gas – and invest a huge amount of time, funds and hard work locating and tapping new sources for their product. If you want to invest in these guys, the one thing you’ll be looking for is how much oil and/or gas is sitting in ‘proved and probable reserves’ owned by the company (reported using the formalism described  above). Those engaged in exploration & production can only maintain and grow their revenue by constantly finding new reserves, and large share price moves often occur around an announcement of such a find.

Buy or Sell?

At Accendo Markets we don’t tell you what to do. It’s your call whether you buy or sell. Our aim is to provide the help you need in highlighting opportunities which may be profitable to you, the trader, and assist you in making trading decisions from which you can benefit by the use of leveraged instruments.

Armed with the information we can give you, as a trader/investor you can make your own decision about what you consider the best opportunities in terms of stocks having potential to rise or fall. It’s your choice as to what you trade and in which direction.

Don’t forget, while many brokers focus purely on what to buy (tapping into investors’ natural bullish bias), Accendo Markets provides trading facilities that allow you to speculate on falling prices (‘going short’). If, for example, you thought a poor trading update would see a share price fall 10%, you could attempt to profit from the decline using one of our trading accounts.

For any questions on how to trade UK stocks via CFDs or shares, including ways in which your risk can be managed, call us to discuss on 0203 051 7461

Page: 01

This research is produced by Accendo Markets Limited. Research produced and disseminated by Accendo Markets is classified as non-independent research, and is therefore a marketing communication. This investment research has not been prepared in accordance with legal requirements designed to promote its independence and it is not subject to the prohibition on dealing ahead of the dissemination of investment research. This research does not constitute a personal recommendation or offer to enter into a transaction or an investment, and is produced and distributed for information purposes only.

Accendo Markets considers opinions and information contained within the research to be valid when published, and gives no warranty as to the investments referred to in this material. The income from the investments referred to may go down as well as up, and investors may realise losses on investments. The past performance of a particular investment is not necessarily a guide to its future performance. Prepared by Michael van Dulken, Head of Research

Spread bets and CFDs are complex instruments and come with a high risk of losing money rapidly due to leverage.
Spread bets and CFDs are complex instruments and come with a high risk of losing money rapidly due to leverage. 67% of retail investor accounts lose money when spread betting and/or trading CFDs with this provider. You should consider whether you understand how spread bets and CFDs work and whether you can afford to take the high risk of losing your money.
.