X

Get our occasional Market Report emails

sent straight to your inbox

There’s no charge for this.

Getting latest data loading
Home / Special Reports / Santa Rally: Are the traditional year-end gains already in motion?

This report is not a personal recommendation and does not take into account your personal circumstances or appetite for risk.

2 November 2015

Santa Rally: Are the traditional year-end gains already in motion?

Santa Claus is coming to trade…

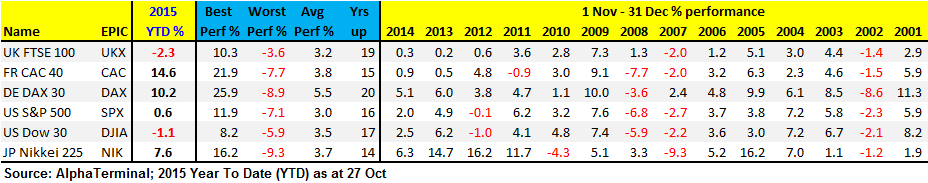
In the business world, Christmas definitely gets earlier each year. Equities have arguably already begun what the old adage hails the ‘traditional year-end gains’ or ‘Santa Rally.’ While there’s no reason to suggest it’s a given that markets always rally into year-end, certain conditions tend to prevail that provide buoyancy - namely ‘window dressing’ by fund managers who hold onto stocks that have done well in order to entice new clients for the coming calendar year. Such hoarding of in-demand stocks can often cause bigger than normal price appreciation.

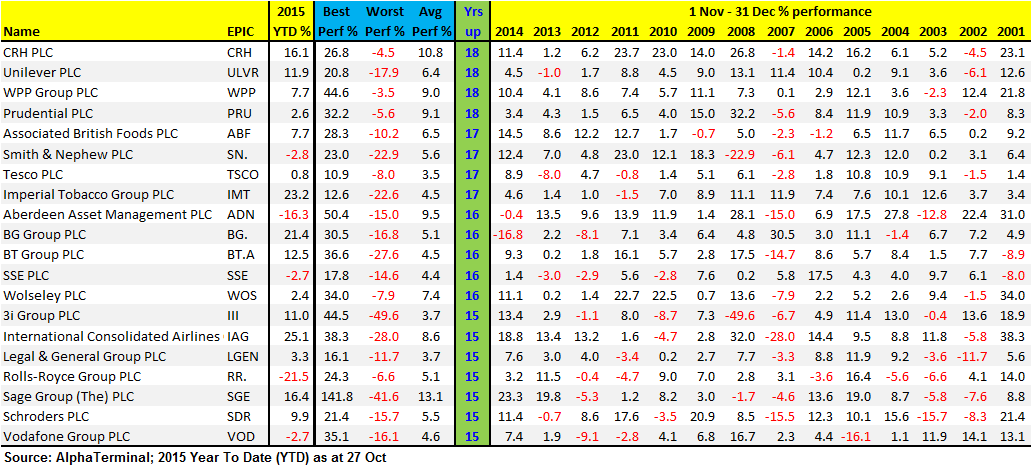
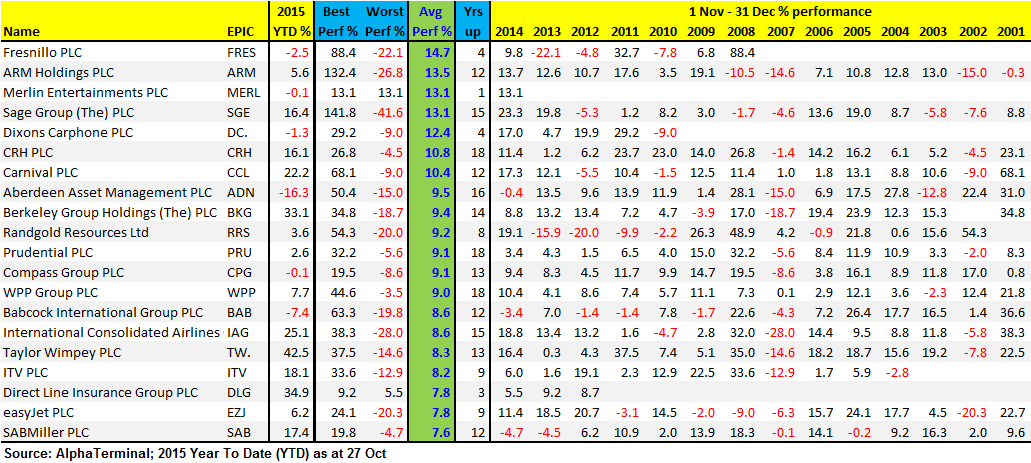
Have you done your shopping for the stocks with the best potential? We normally send this report out at the end of November, but this year that’ll be too late. We have updated our data early for the second year running on account of current market conditions.

UK 100 Index – Santa Rallies 2009-2014

  UK 100  Cash (-)

Technical Observations

  • The graph highlights the UK 100 ’s last five Santa Rally periods (blue boxes) giving an idea of the volatility available. Will 2015 add to the historic tally of 11 gains >3%? Or will it disappoint like 2004 with gains of just 0.2%, or even decline like it did in ’00, ‘02 and ’07?
  • Will correction take hold again for a re-visit of 5770? Or will the recovery take us back to near all-time highs of 7120, giving a net 9.5% gain for the year?

Page: 01

23yr 83% success rate

Since 1992 the UK 100 index has risen 19 times (83% of the time) from early-November to end-December with performance ranging between a soft 0.2% and an impressive 10.3%. On 11 occasions gains topped 3.0% while the average return for the period is a handsome 3.2%.

Disappointments belong to 1994 (-2.2%), 2000 (-3.3%) as the Tech bubble began to deflate, 2002 (-3.7%) just before the market bottomed out in Mar ‘03 before rallying 100% to financial crisis in 2007. The best years still belong to ‘92 (5.5%), ‘93 (10.5%), ’97 (8.3%), ’98 (7.7%) and ’99 (6.1%) and ’08 (4.8%).

UK Index still to play catch-up?

  • It’s encouraging to see in the below table the UK’s UK 100 still has the best record for rising from early-Nov since 1995.

But it also shows the UK Index still underperforming peers by up to 17% - that’s a bigger gap than last year’s maximum 12%. Does this make an even stronger case for a reversion towards the mean by the UK Index ?

UK 100 and global peers' performances through November and December

Indices

No guarantees, but statistics support

This report is designed to help you identify how the blue-chip equities you like have fared over the last 20 years and to decide which could offer you the best trading ideas as 2015 draws to a close.

There is no guarantee that the tallies of success will increase or that the average gains will hold. With history and a weight of data addressing both boom and bust periods, however, the probability is high. After a particularly volatile run-up, the UK 100 could be well positioned for a solid Santa Rally.

Note that we could have looked at just the last few years, when the market was recovering from its financial crisis lows with help from central banks. However, this would boost the average year-end performance unfairly, hence our averaging of the maximum amount of data available to provide you with a more realistic, albeit potentially more conservative observation from which to work.

Will 2015 be an up year?

After making new all-time highs in April, jitters about global growth (China, Eurozone), a third Greek bailout and the US continuing to push back monetary policy normalisation (now slated for 2016) saw markets engage in considerable volatility culminating in a hard sell-off in late August.

Equity markets are now trending upwards from 24 August lows, yet remain some way from those highs of earlier in the year. A trip back to April all-time highs for the UK Index implies 11% upside from late October levels. But even if Eurozone/China woes scupper things again, it’s not a problem - you can also trade short.

To find out which UK 100 stocks tend to fare best from early-November, read on…

Page: 02

Best UK 100 risers from 1-Nov (by no. of years)

stocks up years

Remember, these are past statistics. Statistics are great for identifying trends, but given what happened in Q3, we may see some of the most discounted stocks such as Glencore (GLEN), Anglo American (AAL) and Standard Chartered (STAN) post sizeable % gains into this year’s end, while fellow laggard Aberdeen Asset Management (ADN) could improve upon its average 9% gain.

Conversely, BG Group (BG.) may just be headed for a down period this year after oil prices collapsed. Note also the complete absence of banks from either table. With Lloyds Banking Group (LLOY) shares tumbling on PPI provisions, but with a positive outlook remaining growth and recovery-wise and a now even more attractive share price, might we see the much talked of bank rally into year-end? Note that one must always take stock of current market conditions in order to gauge the particular mood right now.

Best UK 100 risers from 1-Nov (by % gains)

Stocks risers

Page: 03

Before taking a position in the Index or Stocks, be sure to contact Accendo for…

  • Updates - How does the index or your preferred stock look in terms of investor sentiment? News and broker updates can emerge daily affecting share prices. Optimism can switch to pessimism in the blink of an eye depending on what’s going on around the world.
  • How to use CFDs and Spread Bets to maximise your profit potential.
  • How to use the tools available to minimise the risk involved.

Read on to find out what makes Accendo Markets stand out from the rest.......


The Accendo approach – what’s different?

At Accendo Markets we don’t tell you what to do. It’s your call whether you buy or sell. Our aim is to provide the help you need highlighting opportunities which may be profitable to you, the trader, and assist you in making trading decisions from which you can benefit by the use of leveraged instruments.

Our approach focuses on 3 elements below;

  • Education - not obligation
  • Observations - not recommendations
  • Assistance - not persistence

Our unique and award-winning service provides you with the help and tools you need to make appropriate trading decisions in the financial markets, both to grow and protect your capital.


------------------------------------------------------------------------

For any questions on how to trade the UK Index or its Stocks via CFDs or shares,

including ways in which your risk can be managed,

call us to discuss on 0203 051 7461

----------------------------------------------------------------------


Open a Demo account CLICK DEMO

Subscribe to a Free Research trial CLICK RESEARCH

Apply for a Live Account  CLICK ACCOUNT


Page: 04

This research is produced by Accendo Markets Limited. Research produced and disseminated by Accendo Markets is classified as non-independent research, and is therefore a marketing communication. This investment research has not been prepared in accordance with legal requirements designed to promote its independence and it is not subject to the prohibition on dealing ahead of the dissemination of investment research. This research does not constitute a personal recommendation or offer to enter into a transaction or an investment, and is produced and distributed for information purposes only.

Accendo Markets considers opinions and information contained within the research to be valid when published, and gives no warranty as to the investments referred to in this material. The income from the investments referred to may go down as well as up, and investors may realise losses on investments. The past performance of a particular investment is not necessarily a guide to its future performance. Prepared by Michael van Dulken, Head of Research

Spread bets and CFDs are complex instruments and come with a high risk of losing money rapidly due to leverage.
Spread bets and CFDs are complex instruments and come with a high risk of losing money rapidly due to leverage. 67% of retail investor accounts lose money when spread betting and/or trading CFDs with this provider. You should consider whether you understand how spread bets and CFDs work and whether you can afford to take the high risk of losing your money.
.