X

Get our occasional Market Report emails

sent straight to your inbox

There’s no charge for this.

Getting latest data loading
Home / Special Reports / Santa to deliver again in 2014?

This report is not a personal recommendation and does not take into account your personal circumstances or appetite for risk.

17 November 2014

Santa to deliver again in 2014?

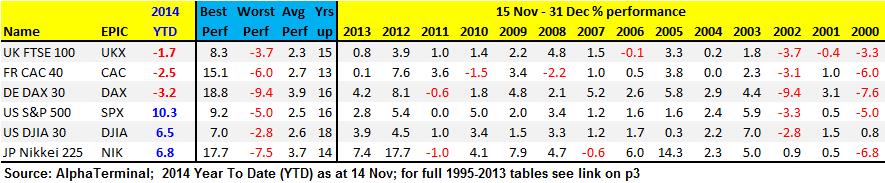
Well known phenomenon

It’s not long before equities begin what the old market adage hails as traditional year-end gains or the Santa Rally. Have you done your shopping for the stocks with the best potentialNormally sent end-November, we have updated our data early on account of current market conditions and self-fulfilling nature of the phenomenon tending towards an earlier start each year. While we don’t subscribe to the view that ‘shares always rally into year-end’, fuelled by volatility thinner holiday volumes and window-dressing (fund managers wanting to hold what’s done well; illusionary), what we do know is that the  UK 100  index has a strong tendency to rise from mid-November through year-end, offering short-term traders potentially profitable trading opportunities.

UK 100 Index – Santa Rallies 2009-2013

UK Index

Technical Observations

  •  The graph highlights the UK 100 ’s last five Santa Rally periods (blue trend boxes) giving an idea of the volatility available. Will 2014 add to the historic tally of 10 gains >3%? Or will it disappoint like 2004 with gains of just 0.2%? Maybe even decline like ‘00-‘02 and ’06?
  • Will correction take hold again and we revisit 6070? Or will the recovery take us back to near all-time highs of 6950 making it a 2.2% gain for the year?

22yr 90% success rate

Since 1992 the UK 100  index has risen 17 times (77% of the time) from mid-November to end-December (90% for Dec alone) with gains between a soft 0.2% and impressive 10.5%. On 10 occasions gains topped 3.0% (‘92, ‘93, ’95-99, ‘05, ’08, and ’12). Average return for the period is 2.6%. Disappointments belong to 1994 (-2.2%), 2000 (-3.3%) as the Tech bubble began to deflate, 2002 (-3.7%) just before the market bottomed out in Mar ‘03 before rallying 100% to financial crisis in 2007. The best years belong to ‘92 (5.5%), ‘93 (10.5%), ’97 (8.3%), ’98 (7.7%) and ’99 (6.1%) and ’08 (4.8%).

UK Index to play catch-up?

  • The below table highlights the UK 100 versus major peers, showing the UK index has the best record for rising from mid-Nov since 1995 (see link on the following page for all ‘95-‘13 data).
  • It also shows that the UK Index is currently underperforming peers by up to 12%. Could this imply the coming weeks acting as a catch-up period before the New Year?

Table

No guarantees, but statistics support

This report is designed to provide you with information to help identify how the blue-chip equities you like have fared over the last 20 years (less data available for stocks than indices) and to decide which could offer you the best trading profit potential as 2014 draws to a close. There is no guarantee that the tallies of success increase or that the average gains hold. With history and a weight of data including booms and busts on their side, however, the probability is good. After a tough year maybe it’s time for the UK index to have its day in the sun. Maybe even in the snow? Note that we could have looked at just the last few years, when the market was recovering from its financial crisis lows with help from central banks. However, this would boost the average year-end performance unfairly, hence our averaging of the maximum amount of data available to provide you with a more realistic, albeit potentially more conservative observation from which to work.

2014 to be different?

After making new multi-year highs in September, jitters about global growth (China, Eurozone) and the US moving towards monetary policy normalisation saw markets sell off hard to test 2013 lows. However, a bullish tone from the US Fed, strong US GDP and Q3 earnings, the BoJ replenishing the punch bowl and speculation the ECB will have to act has seen markets rebound strongly. US equities are already back making new highs, up handsomely for 2014 as a whole. Will European bourses play catch up, taking the UKX back to 6900 (+4.0%) and even on to make new all-time highs? Or will it disappoint and the current correction persist? Will Eurozone/China woes scupper things again? Not a problem – you can also trade short. To find out which UK 100 stocks tend to fare best (or worst if you prefer) from mid-Nov, read on…

Best UK 100 riser from mid-Nov (by no. of years)

 Risers by years

Best UK 100 riser from mid-Nov (by % gains)

 Risers by %

For access to the full tables of 1994-2013 sortable data to see where your preferred stocks and sectors stand click here.

Trade Examples:

Whether you see the index or its components going up or down through year-end one thing is for sure - tradable opportunities will present themselves. Below are some examples to help you profit from the UK index and the potential moves of its constituent members. Trading the Index If you believe the index can regain recent highs of 6900, this implies 270pts upside from here. Going long on the UK 100 index at £10 per point would require a £230 deposit and net you a £2,700 profit if called correctly. If the index fell by 270pts however, you would of course lose £2,700. You can limit your potential loss with the use of a stop loss. For example, you might decide to go long at £10 per point using a 100pt stop loss. If you call the direction wrong and the index falls by 100pts, you would be stopped out with a £1,000 loss. Of course it is completely up to you, A) how much you go into the index (2/4/6/10/20/50/100/1000 pounds per point) B) whether you go LONG (think the index will go up) or SHORT (think the index will go down) and C) how far you place your stop loss away if at all (limiting your potential loss).

Trading equities

If you have a particular equity in mind and would like to trade it in 2014 you can do so using just a 5% deposit to gain full exposure. This can be done via CFDs. If you are optimistic on Barclays (BARC)* and wish to gain long exposure worth £10,000 via CFDs, you would require a £500 deposit. If the shares rose 50% into year-end you would stand to make £5,000, just as if you held £10,000 of shares, with CFD leverage magnifying the return on your small deposit. If the shares fell another 50%, however, you would of course be liable for the £5,000 loss. If you are negative on Babcock International (BAB)* and wish to take short exposure worth £10,000 via CFDs, you would require a £1,000 deposit. If the shares fell 25% into year-end you would stand to make £2,500, as if you had sold short £10,000 worth of shares, with CFD leverage magnifying the return on your small deposit. If the shares gained 25%, you would of course be liable for the £2,500 loss. As with indices, you can use stop losses on Equity CFD positions to limit any losses. NB: *Stocks chosen randomly.

Before taking a position in the Index or Stocks, be sure to contact Accendo for…

Updates - How does the index or your preferred stock look in terms of investor sentiment? News and broker updates can emerge daily affecting share prices. Optimism can switch to pessimism in the blink of an eye depending on what’s going on around the world.

How to use CFDs and Spread Bets to maximise your profit potential. How to use the tools available to minimise the risk involved. To find out what makes Accendo Markets stand out from the rest…….

The Accendo approach – what’s different?

At Accendo Markets we don’t tell you what to do. It’s your call whether you buy or sell. Our aim is to provide the help you need highlighting opportunities which may be profitable to you, the trader, and assist you in making trading decisions from which you can benefit by the use of leveraged instruments. Our approach focuses on 3 elements below;

  • Education – not obligation
  • Observations – not recommendations
  • Assistance – not persistence

Our unique and award-winning service provides you with the help and tools you need to make appropriate trading decisions in the financial markets, both to grow and protect your capital.

CFDs – A simple way to increase profit potential

While traditional VOD shares require the full amount be paid up front (e.g. 5,000 shares at 200p, would require the full £10,000 outlay) an identical trade using CFDs involves an initial outlay of just £500 (VOD CFDs require a 5% deposit). The outlay is lower but the risk and reward are the same as if £10,000 of shares were held. The VOD CFD trader benefits/suffers to the same extent as the traditional VOD shareholder but has the advantage of not having to part with the full amount at the outset. He also saves on stamp duty as there is no physical purchase. Best of all, the CFD trader can take a positive or negative view. Should you not be interested in the leverage advantage of CFDs but do wish to purchase VOD shares, you can always treat CFDs like shares (also avoiding stamp duty). Simply deposit the full value of the share position you would like to take (i.e. £10,000) and take an equivalent CFD position (note that overnight financing costs will still apply). Think VOD shares will rise? Take a long position by buying the CFDs. Think its shares will fall? Take a short position by selling the CFDs. For a more detailed rundown of CFDs, their mechanics, associated costs and some trading scenarios click here. Beware that the combination of CFD leverage and bigger share-price movements (volatility) can result in bigger than expected losses which can even exceed your original deposit.

————————————————————————

For any questions on how to trade the UK Index or its Stocks via CFDs or shares, including ways in which your risk can be managed, call us to discuss on 0203 051 7461

———————————————————————-

Open a Demo account CLICK DEMO     

Subscribe to a Free Research trial CLICK RESEARCH

Apply for a Live Account  CLICK ACCOUNT

Page: 01

This research is produced by Accendo Markets Limited. Research produced and disseminated by Accendo Markets is classified as non-independent research, and is therefore a marketing communication. This investment research has not been prepared in accordance with legal requirements designed to promote its independence and it is not subject to the prohibition on dealing ahead of the dissemination of investment research. This research does not constitute a personal recommendation or offer to enter into a transaction or an investment, and is produced and distributed for information purposes only.

Accendo Markets considers opinions and information contained within the research to be valid when published, and gives no warranty as to the investments referred to in this material. The income from the investments referred to may go down as well as up, and investors may realise losses on investments. The past performance of a particular investment is not necessarily a guide to its future performance. Prepared by Michael van Dulken, Head of Research

Spread bets and CFDs are complex instruments and come with a high risk of losing money rapidly due to leverage.
Spread bets and CFDs are complex instruments and come with a high risk of losing money rapidly due to leverage. 67% of retail investor accounts lose money when spread betting and/or trading CFDs with this provider. You should consider whether you understand how spread bets and CFDs work and whether you can afford to take the high risk of losing your money.
.