X

Get our occasional Market Report emails

sent straight to your inbox

There’s no charge for this.

Getting latest data loading
Home / Special Reports / Glencore vs Anglo American

This report is not a personal recommendation and does not take into account your personal circumstances or appetite for risk.

26 August 2018

Glencore vs Anglo American

The Mining industry is one of the more exciting and significant UK 100 sectors, making up over 10% of the index by market capitalisation. Diversified Metals & Mining companies offer the combination of global exposure, solid earnings and attractive volatility to satisfy bullish and bearish investors.

Anglo American and Glencore are two of the most sought-after Mining stocks and many investors are eager to learn more about their potential support and resistance levels, whether they trade reliable ranges and how much upside/downside potential they might have in the short-to-medium timeframe.

Both stocks are 10-20% off their 2018 highs, opening the door for potentially interesting rebounds. But is there danger lurking for investors if the shares continue falling? Where are the main pitfalls for both Anglo American and Glencore?

Anglo American shares recently enjoyed a strong bounce, recovering more than half of the fall from 2018 highs to 2018 lows, leaving Glencore temporarily behind. Glencore shares may be lagging its peer, but its recent price movement could open a door for an even bigger rebound.

The following report goes in-depth on the main drivers that move both these shares and takes a close look at their charts to find support and resistance levels that could be useful to identify key buy and sell signals. Here we unpack the complexities of the two big Miners to help investors get a clearer picture of the business environment and potential tradable opportunities.

All that is left after reading the report is to pick up the phone, call your Accendo Markets broker and discuss your investment options with confidence.

Direct Comparatives

But first, a short primer for those who are familiar with the two companies in this report, but want to learn more about their position and significance within the Mining sector.

Glencore is a globally-diversified developer of natural resources, headquartered in Switzerland. Originally a commodities trading company, it now produces copper (57% of revenues), zinc (28%), nickel (8%) and ferroalloys (7%). It is also a major seller of precious metals, as well as cobalt (crucial for Electric Vehicle manufacturing).

Most of Glencore assets are in Sub-Saharan Africa (DRC, Zambia), South America (Chile, Peru), Canada, Norway and Australia.

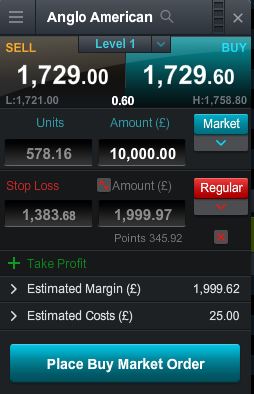
Its key industry peer and competitor Anglo American is a major producer of diamonds (through its world-famous De Beers subsidiary, making up 21% of revenues), as well as metallurgical and thermal coal (29%), iron ore (14%) and copper (13%), plus other products.

Half of its production base is concentrated in South Africa (25% of revenue, platinum, iron ore & diamond production) and Brazil (25%, nickel, iron ore), with other assets in Namibia & Botswana (19%, diamonds), Chile (13%, copper) and Australia (8%, coal). (Source: Companies’ newswires, 8 August 2018)

Financial metrics

On paper, Glencore is a much bigger company by market capitalisation (£48.6bn vs.£24.6bn for Anglo American), 2018 workforce (Glencore: 146K, Anglo American: 69K) and latest earnings (Glencore: $8.27bn; Anglo American: $4.58bn). (Source: Companies’ newswires, 8 August 2018)

Comparing companies by market capitalisation can be misleading, since valuation multiples can be inflated, but looking at their price-to-earnings (P/E) ratios reveals that both Glencore and Anglo American have similar trailing 12-month multiples (9.94 and 9.22, respectively). This suggests that neither of the companies is considered significantly overvalued compared to the other. Their trailing P/E ratios are also below the Mining Index’s (14.2), suggesting that both companies present good investment value compared to their Metals & Mining rivals. (Source: Bloomberg, 8 August 2018)

Sector drivers

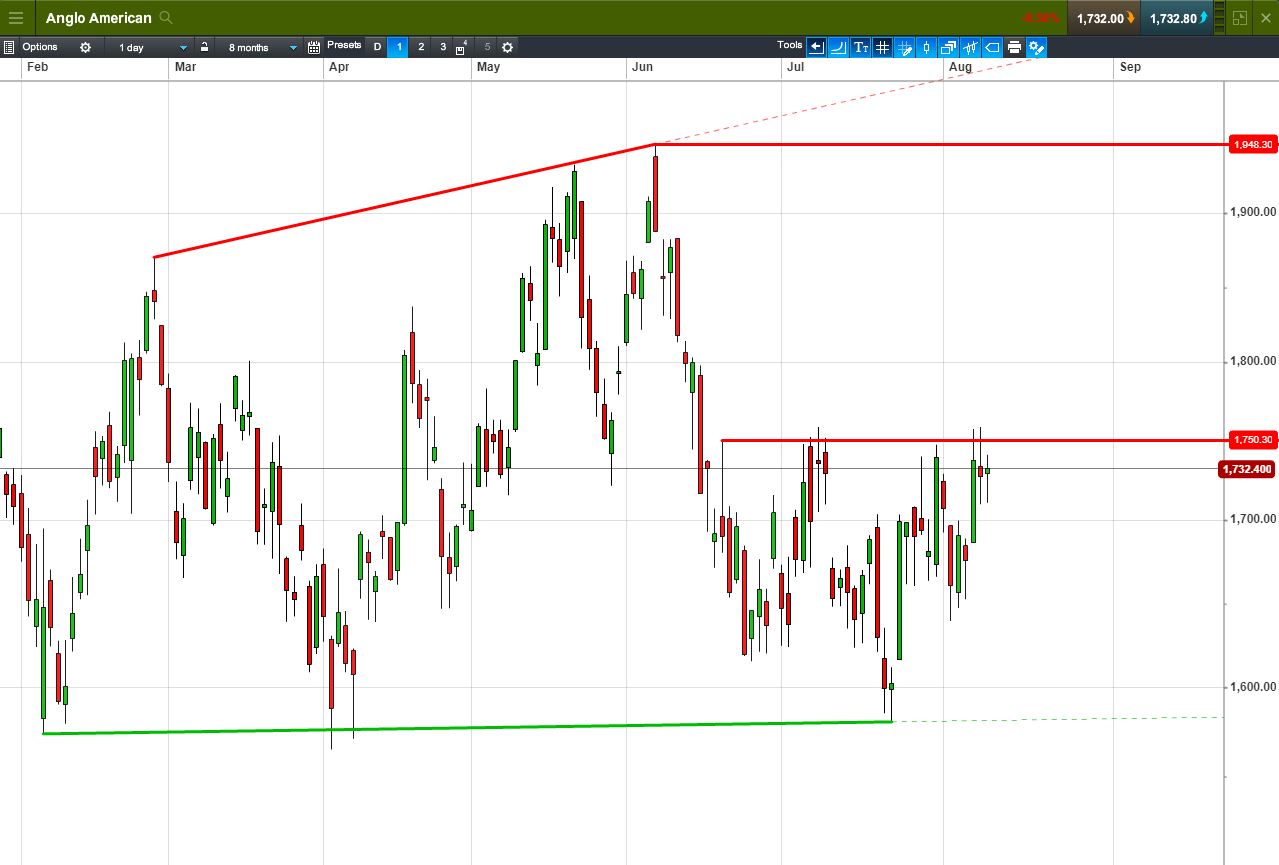
Mining sector as a whole has seen some exciting trading activity in 2018, with significant daily share price swings.

Much of the volatility has been generated by three closely related geo-political/geo-economic drivers: (a) strong USD rally, (b) deterioration of global trade relationship between major economic powers, and (c) mixed macroeconomic signals from China. All three of these factors are closely interlinked and difficult to present in isolation, but the general trend of events includes the following:

  • US Dollar staged a strong rally against major peers, with EUR/USD falling from the highs of 1.255 in mid-February to 1.16 in early August (7.5% fall).
  • USD rally is caused, in part, by Federal Reserve policy of raising interest rates, and new import tariffs on Chinese & EU goods, which benefit US producers.
  • As metals are priced in US dollars, stronger USD led to lower metals prices and lower earnings for UK Index Miners.
  • While copper (a major product for both companies) has not been directly sanctioned by President Trump’s administration, and the focus has been on steel and aluminium tariffs, negative market sentiment has seen copper prices fall 15% from June highs, while zinc prices -18% and nickel prices -13%. (Source: LME, 8 August 2018)
  • US trade war policy may be impacting economic stability in China, which is a major metals producer and consumer. While it is too early to say if China’s growth story is threatened, some indicators (latest GDP, Industrial Production & Manufacturing) are showing worrying signs of a slowdown. Mining shares remain sensitive to both positive and negative Chinese economic data. (Source: Trading Economics, 8 August 2018)
Trading environment

On the individual front, both Glencore and Anglo American also faced their own challenges and triumphs. Latest Anglo American H1 results (26 July) pleased investors, with EBITDA growing 11% YoY (beating consensus expectations), copper production +19%, metallurgical coal +17%, diamonds +8%. Dividend was increased by 2%, while full-year production outlook was reiterated for diamonds, nickel & coal, increased for platinum, though lowered for iron ore.

Latest Glencore results (8 August), however, disappointed, with H1 EBITDA at the lower end of consensus expectations, unchanged dividend and reported volatile price environment. Rising costs were partially blamed for the forecast miss.

Legal issues continue to provide additional drag to Glencore’s share price, including the ongoing US Department of Justice investigation into bribery and money laundering, with the shares falling over 8% on the day of the announcement (3 July). New mining code in the Democratic Republic of Congo, where Glencore has important operations, is also a source of continued dispute due to higher new taxes levied on the company.

For daily analytical coverage of the Mining sector and other UK 100 stocks, you can also sign up to have our research sent directly to your inbox.

Page: 01

The Difference Maker

Ultimately, investors who are interested in Mining sector ask themselves whether they should pick between Anglo American and Glencore or invest a part of the account into each stock to hedge their bets. Despite their similarities, the two companies present very different trading opportunities in 2018. Both stocks have reached a multi-year peak in 2018, but Glencore achieved this level (416.9p) at the end of January and has been on the downtrend ever since. Glencore shares are now down over 21% from 2018 peak. Anglo American shares, however, reached their 2018 peak of 1948p in early June and currently down just ~10% from those highs.

But past performance is only useful as a benchmark and investors are most eager to know the future potential, whether shares found a bottom and ready for a rebound back to recent highs. In this regard, the picture is different. Anglo American shares may be down just 10% from 2018 highs, but they have already recovered much of this year’s losses, advancing 12.8% from 2018 lows. Glencore shares may have suffered steeper losses in 2018 (21% fall from the high), but since finding a bottom in mid-July, Glencore shares bounced back just 7.7%, opening a bigger upside potential for Glencore to recover 2018 highs. (Source: AlphaTerminal, 8 August 2018)

Capital efficiency

People interested in the Mining sector often want to personally benefit from share price volatility by buying or selling company stock. But trading shares directly can sometimes tie up large amounts of capital. One way to take advantage of the opportunities presented by share price movement of UK 100 Miners, by using just 20% of the full value of the position, is to use products called CFDs.

If you want to invest £10,000 into Anglo American or Glencore shares, you can use leverage to maximise your capital’s full potential. If you decide to buy 578 shares in Anglo American at 1729.60p using CFDs, you only need to use around £2,000 (20% margin) instead of the full £10,000 value. The remaining £8,000 can sits on your trading account, either as extra safety buffer for this trade or for other trading opportunities that might catch your eye. On top of that, CFD investors don’t have to pay the 0.5% stamp duty, while receiving many of the same benefits as shareholders, including dividends.

By entering a £10,000 long position with CFDs, you are assuming that that the shares will go up. If Anglo American shares went all the way back to the 2018 high of 1948p (+12.6%), you would have made a profit of £1,266 (before commission and overnight financing costs), or a 63% return on your initial investment. However, if shares instead fell back to the late-July low of 1581p (-8.6%), this would represent a loss of around £856, or a 57% decline of initial outlays. Keep in mind that with CFDs, you can never lose more than the full value of your initial 20%/£2,000 deposit.

On the next two pages, we discuss share price performance of both stocks in more detail. Do you already have an opinion on where Anglo American or Glencore shares will go? Get in touch with one of our brokers to discuss your options.

Source: CMC Markets, 8 August 2018
Example of a notional deal ticket.

Page: 02

Anglo American (AAL)

Source: CMC Markets, 9 August 2018

After reaching a peak of 1948p on 7 June, Anglo American shares have seen a sharp fall in mid-June, followed by a rebound from the support level of 1580p. Shares have touched this support level six times since the beginning of the year. More recently, shares have started trading in a range, touching the resistance level around 1750p six times since late June.

Will Anglo American return to June highs of 1948p (+16.5%) or fall to July lows of 1580p (-5.5%)?

  • Downtrend in June on the back of global trade war concerns.
  • Trading in a 1580-1750p range in July.
  • MACD still negative, but moving higher (moderately bullish signal).
  • Momentum is getting stronger (supporting the uptrend).
  • 200-day Moving Average support around 1654p.

Broker Consensus: 48% Buy, 36% Hold, 16% Sell
Bullish: Jefferies, Buy, Target 2400p, +43% (26 Jul 18)
Average Target: 1853p, +10% (9 August 18)
Bearish: Liberum, Sell, Target 800p, -52% (1 Jul 18)

Pricing data sourced from Bloomberg on 9 August 2018. Please contact us for a full, up to date rundown.

Glencore (GLEN)

Source: CMC Markets, 9 August 2018

Glencore reached a peak of 416.9p on 29 January after a prolonged December rally that mirrored other Miners, but the uptrend stalled and lost strength in Q1 2018. On 3 July, Glencore share price fell 8.1% on the news of a US department of Justice investigation of money laundering activity in Africa and Latin America. Company shares then found a support around the 308p level, bouncing from it six times in July-August period. Since then, shares have been trading in a narrow range.

Will Glencore return to 2018 highs of 416p (+32.5%) or fall to June 2017 lows of 275p (-12.4%)?

  • Sharp fall in July following announcement of US investigation into company.
  • Consolidation around July 2017 lows; trading in a 308-337p range.
  • Stochastics indicator breaking below MACD (a bearish sign).
  • Bearish cross by Directional Indicators.

Broker Consensus: 77% Buy, 20% Hold, 3% Sell
Bullish: NOAH Capital Markets, Buy, Target 782.37p, +149% (29 Jun 18)
Average Target: 435.8p, +38% (9 August 18)
Bearish: Morningstar, Hold, Target 250p, -20% (4 Jun 18)

Pricing data sourced from Bloomberg on 9 August 2018. Please contact us for a full, up to date rundown.

Page: 03

Want to take advantage of the above opportunities right now?

Whether you see UK Stocks going up or down for the remainder of the year, tradable opportunities will present themselves regularly. We’re here to help you weed them out and capitalise on them. Accendo Markets can help you increase your profit potential with the use of leveraged instruments such as CFDs, a flexible alternative to traditional shares that is currently exempt from UK stamp duty.

CFDs: Like shares, but more flexible

While buying 9,561 shares in IQE @ 104.58p requires an outlay of around £10,000 plus commission, the same exposure via a CFD requires about £2000 plus commission (see right-hand box; margin + costs). If a trader invests in IQE, one would assume they believe the share price is likely to move in their favour. After considering the ‘worst case scenario’ and assigning funds to cover it, the trader may conclude there’s little point in exposing the full £10,000 to IQE shares - some of that capital could be put to good use elsewhere in the markets. (Source: CMC, Prices indicative)

CFDs are leveraged instruments, but you don’t have to use leverage

If you had, say, £10,000 to invest in the stock market, you could deposit that amount into a share dealing account and purchase shares in a company. You would pay commission to open the position, 0.5% in stamp duty and the full £10,000 will be tied up in your chosen shares with any profit or loss based on that exposure. The same £10,000 worth of exposure can be secured with a CFD for a fraction of the initial outlay thanks to leverage, with the risk and reward the same as if £10,000 worth of traditional shares were held. But should you not be interested in leverage, you can always treat CFDs like shares. Simply deposit £10,000 into a CFD trading account and take the equivalent CFD position which will tie up as little as 20%/£2000 (note that overnight financing costs will still apply). The remaining £8,000 is not tied up, so you can use some of that to take advantage of another short-term opportunity elsewhere, or simply leave it on the account to support any losses. Best of all, using a CFD means you pay no stamp duty!

What’s your view?

Think shares will rise? Take a long position by buying CFDs (buy low, aiming to sell high). Think they’ll fall? Take a short position by selling CFDs (sell high, aiming to buy low). For a more detailed rundown of CFDs, their mechanics, associated costs and some trading scenarios download our ‘Comprehensive Guide to CFDs’ here.

Page: 04

The Accendo Markets Research Offering

Does your current broker’s morning report tell you all you need to know about yesterday’s news? If so, how is it offering you anything more than the plethora of information already available on the internet?

We’re proud that our morning editorial has become a hot commodity in the City, its content quoted daily by the journalists that are writing the news everyone else will be reading later in the day, if not the next. Our morning report tells you what’s driving the market at that moment and what to look out for in the day ahead.

If a company has reported earnings before the market opens, we’ll tell you why the shares are called to open up or down in relation to that announcement.

As well as the Morning Report, signing-up to Accendo Markets Research & Trade Ideas offers you the chance to receive the following publications:

  • Another Level: A selection of key level alerts on various stocks.
  • Index Focus: A selection of key level alerts on the major indices.
  • Trade Alerts: Trading ideas from our analysts. What do they think is likely to move?
  • Macro Calendar: Live market-moving data, breaking news as it happens
  • Week in Advance: A summary of next week’s key events. Is there a trading opportunity there for you?

To ensure you can act as quickly as possible, you’ll receive an email with a link to the latest publication as soon as it’s released. You can unsubscribe from these emails at any time.

Based on a wealth of experience, gained from both large and small institutions, our Research and Trade Ideas are produced in-house. Our team of dedicated professionals comprises both analysts and traders, drawing upon a wide range of resources and methodologies.

Our aim is to provide you with the manpower and expertise you need to help you clarify, interpret and capitalise on the ever-growing volume of market information.

The journalists don’t pay for it and neither do you, so why not give it a go? You’ve nothing to lose and perhaps a little more to gain…

Page: 05

This research is produced by Accendo Markets Limited. Research produced and disseminated by Accendo Markets is classified as non-independent research, and is therefore a marketing communication. This investment research has not been prepared in accordance with legal requirements designed to promote its independence and it is not subject to the prohibition on dealing ahead of the dissemination of investment research. This research does not constitute a personal recommendation or offer to enter into a transaction or an investment, and is produced and distributed for information purposes only.


Accendo Markets considers opinions and information contained within the research to be valid when published, and gives no warranty as to the investments referred to in this material. The income from the investments referred to may go down as well as up, and investors may realise losses on investments. The past performance of a particular investment is not necessarily a guide to its future performance.

Prepared by Michael van Dulken, Head of Research
Spread bets and CFDs are complex instruments and come with a high risk of losing money rapidly due to leverage.
Spread bets and CFDs are complex instruments and come with a high risk of losing money rapidly due to leverage. 67% of retail investor accounts lose money when spread betting and/or trading CFDs with this provider. You should consider whether you understand how spread bets and CFDs work and whether you can afford to take the high risk of losing your money.
.