X

Get our occasional Market Report emails

sent straight to your inbox

There’s no charge for this.

Getting latest data loading
Home / Special Reports / UK Index Miners at historic lows: Are they ready to bounce?

This report is not a personal recommendation and does not take into account your personal circumstances or appetite for risk.

20 July 2015

UK Index Miners at historic lows: Are they ready to bounce?

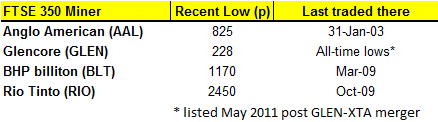
Miners at record lows

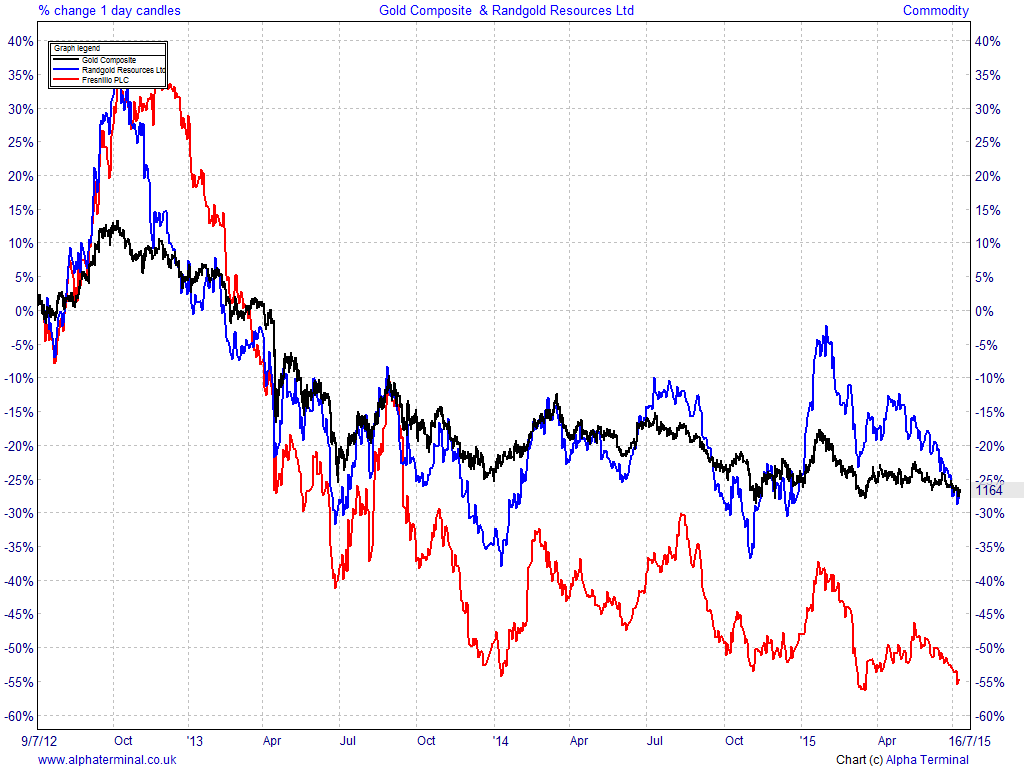
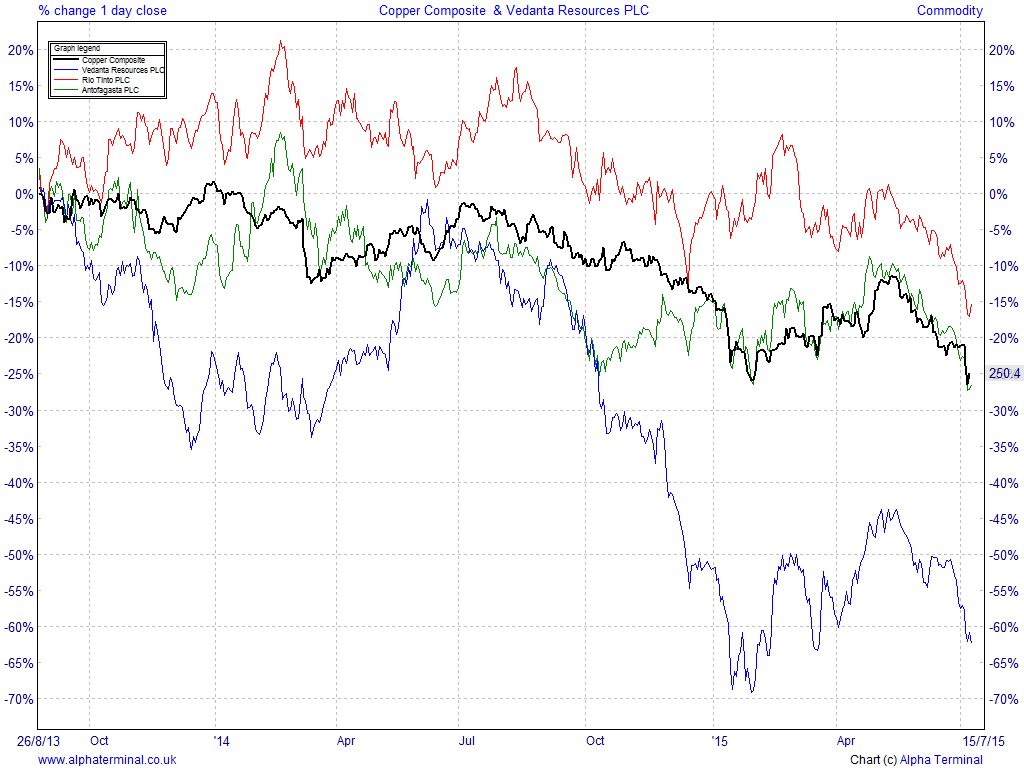
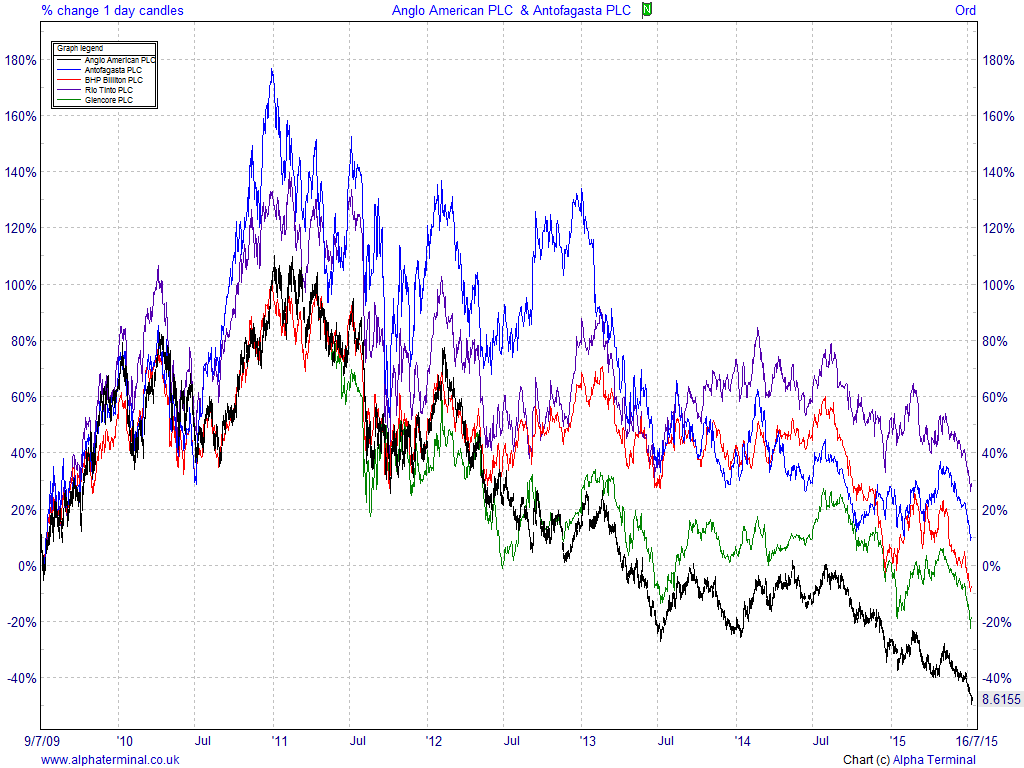
UK Index mining stocks have fallen from grace of late with share prices posting losses over the past 5 years of up to 85% (in the case of Lonmin (LMI)) in the midst of dire conditions in the raw materials sphere.

We’re wondering just how much further these stocks can fall before finding support. The situation in China is making for volatile (aka opportune) times in the commodity markets and with an end in sight to the Greek debt saga, but could and impending return to certainty be set to reinvigorate the sector? However things pan out, we thought it best to have a look at the UK Index miners to see if real opportunities are likely to present themselves imminently.

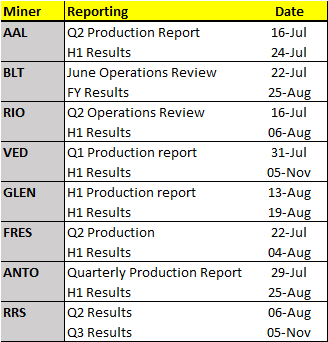
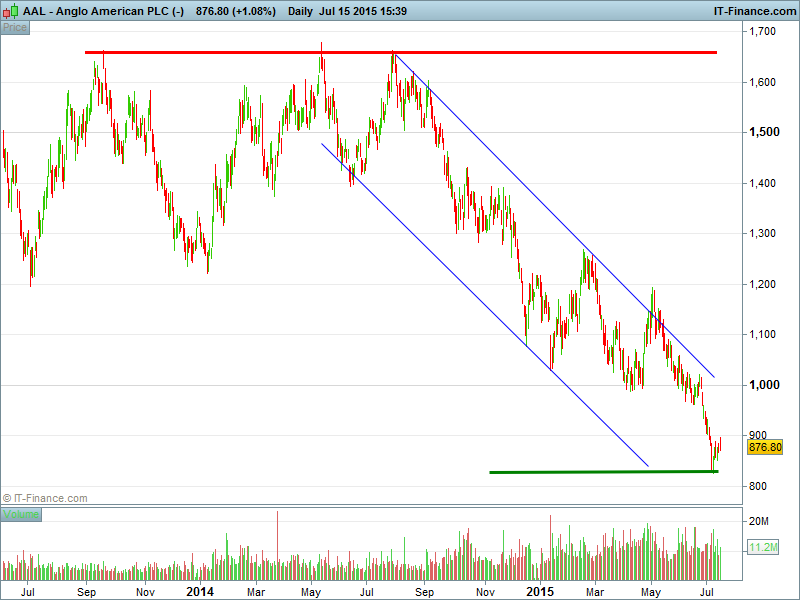
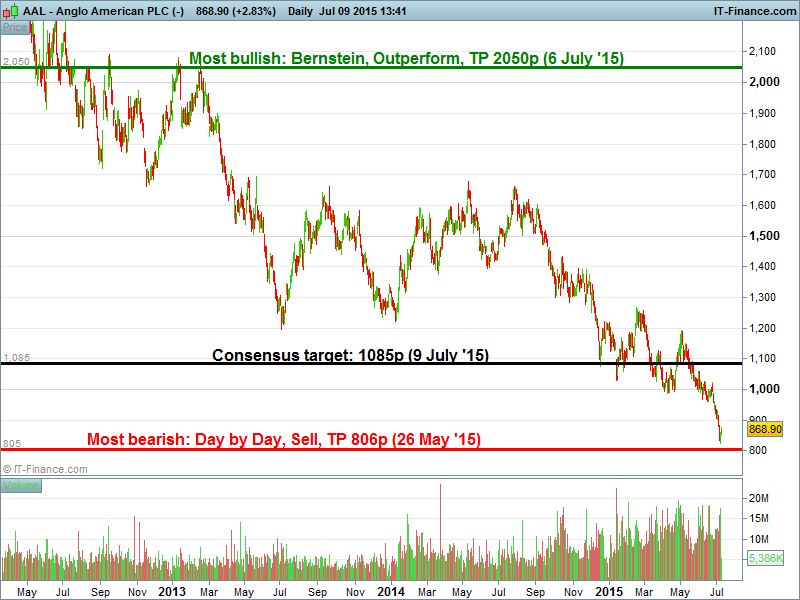
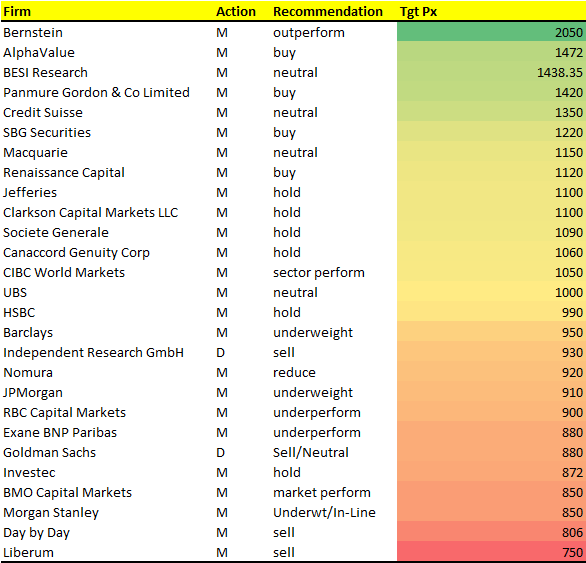
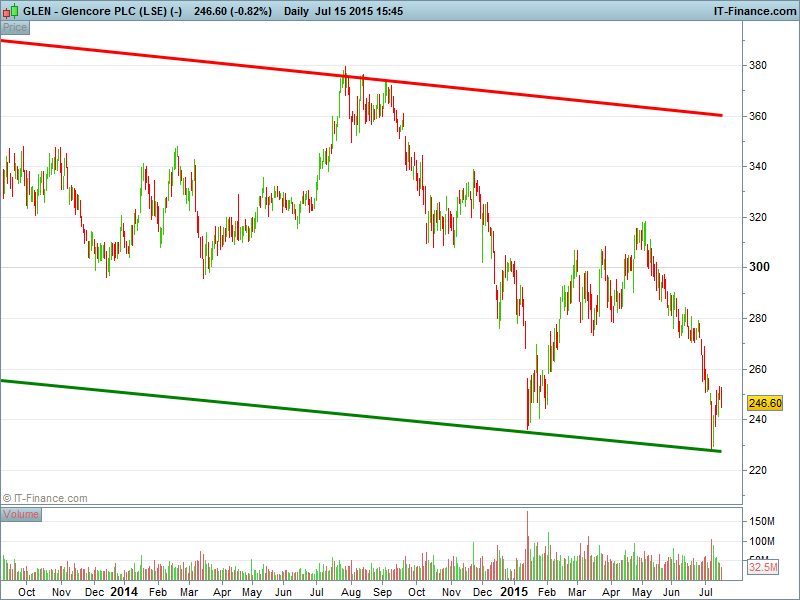
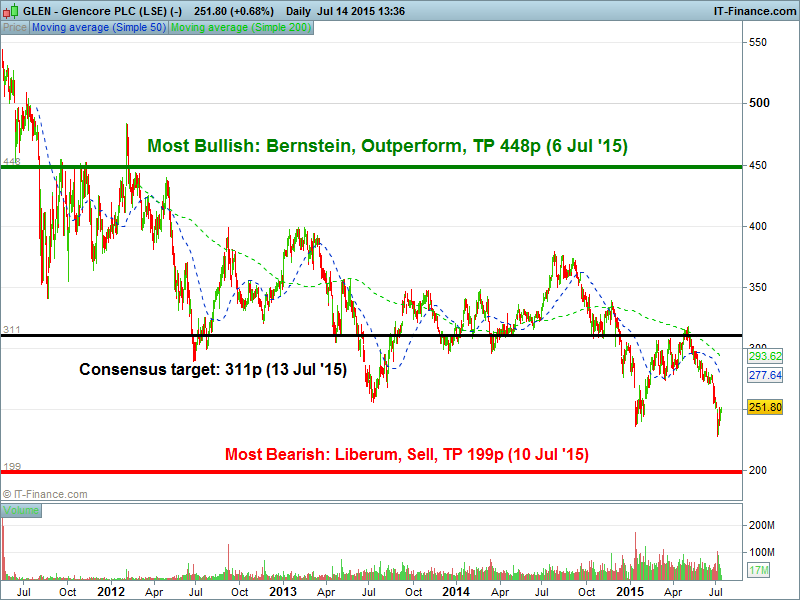
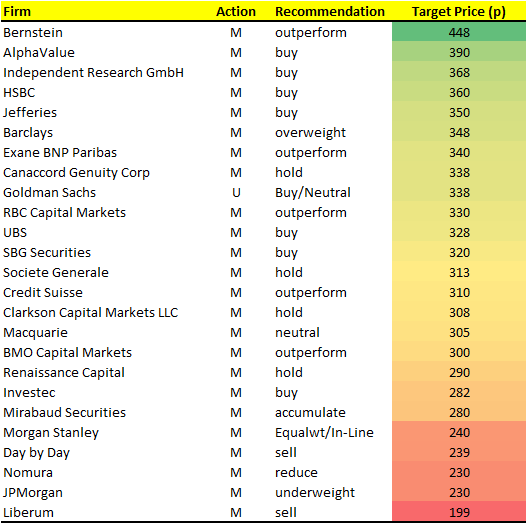
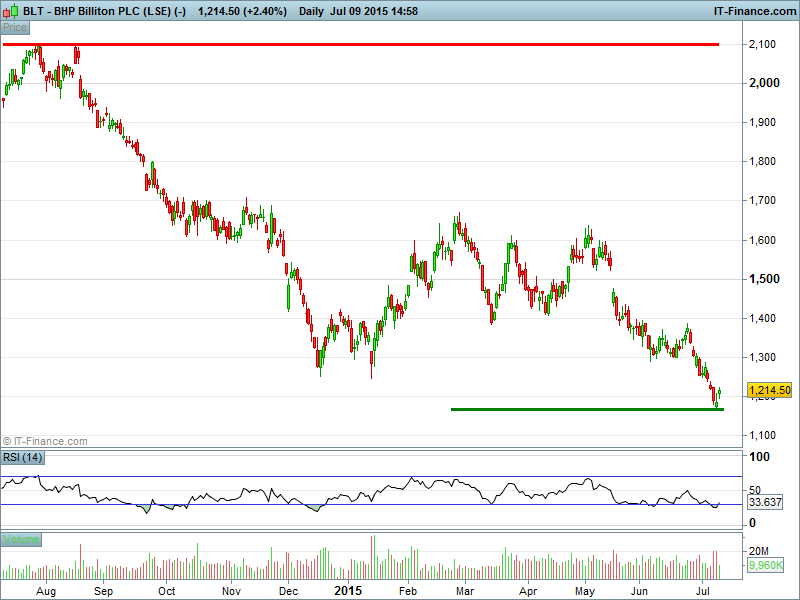
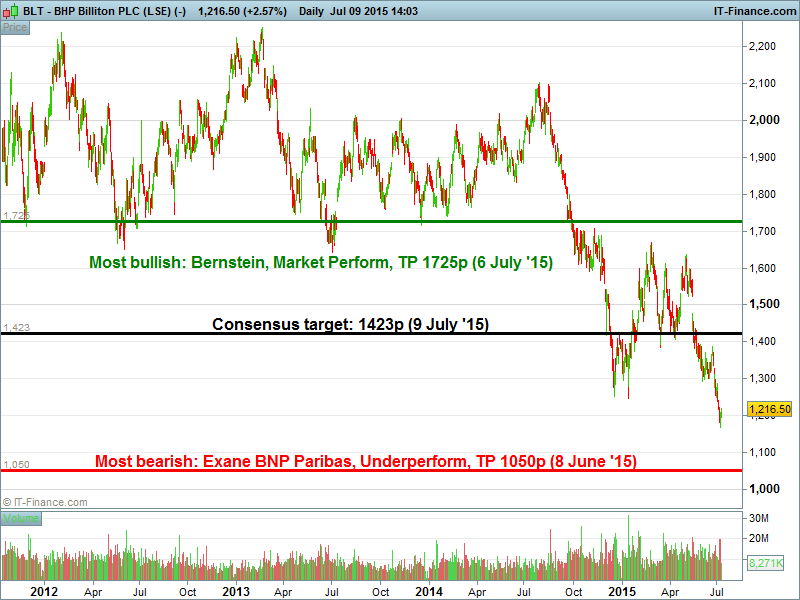
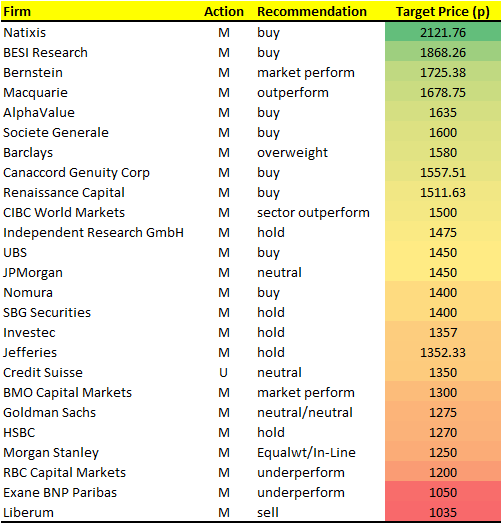
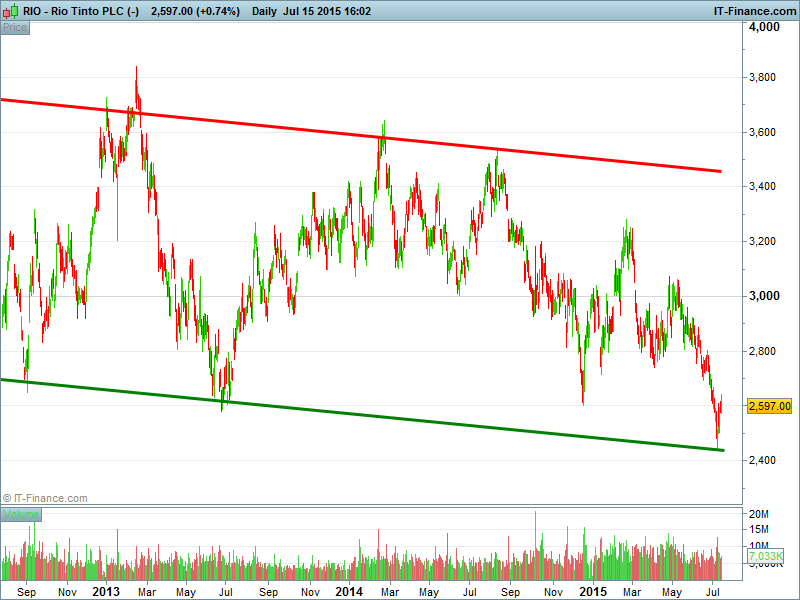
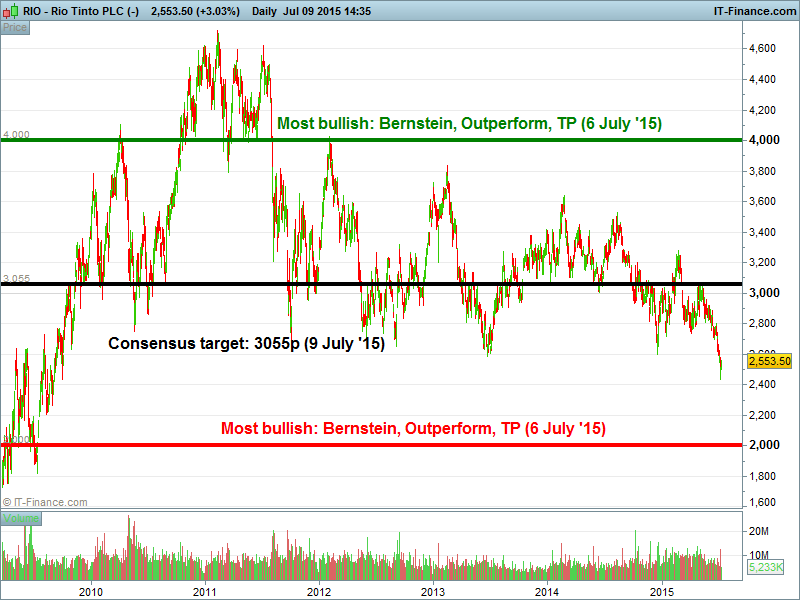
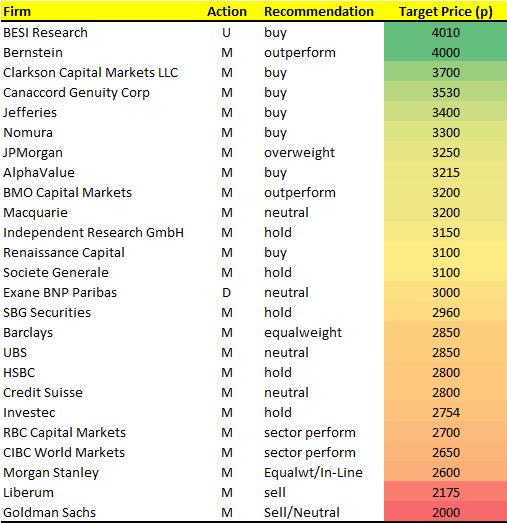
In this exclusive report we’ll concentrate on the big names in the UK 100 - Anglo American (AAL), BHP Billiton (BLT), Glencore (GLEN) and Rio Tinto (RIO), looking at the key macro drivers for the sector as well as some technical levels and broker recommendations for each stock.

Levels not seen since…

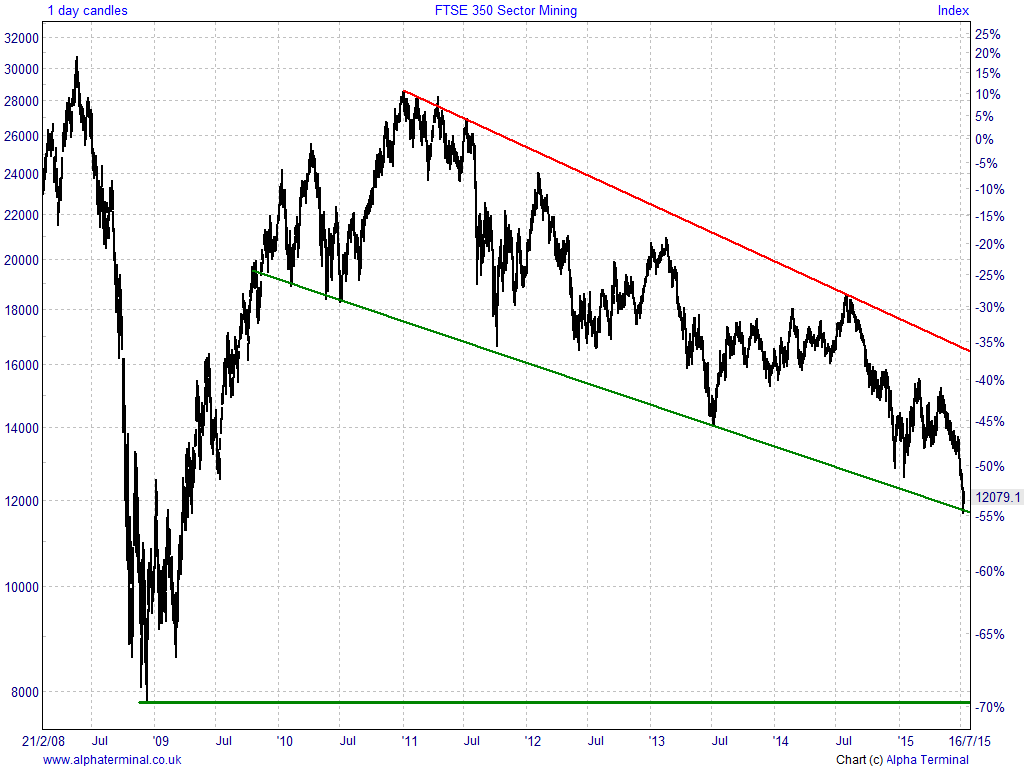
Some of the UK 100 miners are now trading at levels not seen for many years. Since UK 100 made all-time highs in May 2015, Chinese market volatility and general global uncertainty have pressured already strained commodity prices.

levels

Source: Bloomberg, 9 July 2015

Both BHP Billiton and RIO Tinto, down 23% and 14% since May, are currently at levels not seen since 2009 while Anglo American, down 22% since May last traded at its current price in Q1 2003!

Could now be time for a rebound in these squeezed stocks – whose potential is virtually limitless given they produce some of the world’s most in-demand materials?

Are the spectres of Chinese ghost-towns and global economic sluggishness set to haunt the basic materials space for further years to come, driving share prices into a new long-term trading range?

Remember, with Accendo you get the ability to speculate on falling as well as rising prices.

The dramatic fall from grace

Since post crisis highs of early 2011 the  Mining sector has been in a clear downtrend channel (although with attractive rises and falls along the way) driven by China woes, a perennially problematic Eurozone and questionable US recovery.

Mining Sector Chart
(6-years,daily)

 Mining Sector

Source: Alpha Terminal, 9 July 2015

Now trading around the falling channel floor line, is the sector set for a rally back to recent highs or the channel ceiling? Or will it breakdown below the floor to revisit the lows of early 2009. Who is set to do best or worst whether we rise or fall? Who will out- and under-perform?

Gold & Silver

The gold price has been struggling of late with a stronger USD from the threat of a US rate rise making the dollar-denominated safe-haven metal more expensive to have in one’s portfolio. Furthermore, it has not really been displaying the characteristics of the proverbial ‘port in a storm,’ failing to do well while the world has been worrying increasingly about Greece and now China.

Gold Composite (6-years, daily)
Gold Composite

Source: Alpha Terminal, 9 July 2015

It’s a similar situation for Silver which remains in a solid downtrend ever since it hit all-time highs in early 2011. In fact we note that it has even broken its longer term rising trend, meaning further downside could be on the cards.

Silver Composite (6-years, daily)

Silver Composite
Source: Alpha Terminal, 9 July 2015

This would explain the major underperformance of Mexican-based precious metals miner Fresnillo (FRES) (the red line) on the next graph which is in decline since late 2012.

At the same time, note how Gold miner Randgold Resources (RRS) has performed exactly in line with the Gold price in percentage terms. Is there potential for convergence and a recovery trade on Fresnillo here?

RRS, FRES Vs. Gold

Gold, RRS, FRES

Source: Alpha Terminal, 9 July 2015

Copper

Copper is a metal virtually welded to China’s economy and absolutely necessary for the economic growth of the world’s #2 economy given its use in electronics.

Declines in the price of the red metal have hit Vedanta Resources (VED) very hard, while blue-chip rivals Rio Tinto (RIO) and Antofagasta (ANTO) have held up remarkably well despite banking heavy losses from mid-April.

VED, RIO, ANTO Vs. Copper

Copper, Miners

Source: Alpha Terminal, 9 July 2015

UK 100 Heavyweights

The below graph highlights the divergence in performance between the UK’s listed Miners. The poor performance of Anglo American shares may explain its return to popularity in terms of a possible reversal and, despite falls across the board of late, it is interesting to note the relative resilience of many names – like Rio Tinto - when taken over the last 5 years.

UK Listed Miners

Miners

Source: Alpha Terminal, 9 July 2015

Reporting season beckons

Q2 reporting season is well underway and following those of the UK banks, the miners are set to report their H1 results and give Q2 updates together with guidance for the rest of the year. It’s arguably the guidance investors will be eyeing with most interest, since the recent tough times experienced by the miners are almost certain to be expressed in their results.

Standard financial levers such as reducing headcount and limiting funding to only the best quality projects are long-turned-to ways to react to a downturn. But we don’t live in ‘standard’ times anymore.

What we want to see are fresh ideas to take the sector forward as commodity prices languish on lower demand – miners embracing high technology to automate and improve productivity, big data to find and cut unnecessary cost centres, novel ways to navigate potential currency headwinds from a strengthening US dollar, the list could go on. One thing’s for sure – he who uses these quiet times to investigate and innovate will set himself up comfortably for the future.

Key dates

Key dates

Anglo American (AAL)

AAL - 2 year, daily

Anglo American PLC (-)

Source: IT Finance, Alpha Terminal 15 July 2015

One of the stocks highlighted at the beginning of the report – currently trading at levels not seen since Q1 2003 and right above the most bearish broker target price, where do you see shares in AAL going in the near- to mid-term?
On 15 July AAL announced it would cut its dividend, which may set alarm bells ringing, but this is the almost inevitable result of a long term commodities slump. The company has not done this since the financial crisis, which may be viewed as a sign of resilience. While it’s never a good thing to hear, isn’t it inevitable that miners may have to resort to this to preserve capital so that when the opportunity for a recovery presents itself, they are fully able to capitalise?

Best, worst and average broker targets on AAL

AAL Consensus

Source: IT Finance, 9 July 2015

The recovery potential of AAL, as with many of the UK Index miners, is considerable. While completion of a 15-year double top pattern indicates 25% downside for the stock from here, a bounce off support at 828p and subsequent break-out of the 12-month falling channel would make for a potential 88% upside – giving a healthy risk/reward of 3.5x.

Latest AAL broker targets

AAL lightmap

Source: Bloomberg, 9 July 2015

Broker targets are averaging the redder side of neutral; however we note a current slew of upgrades, downgrades and target price changes on the miners which are starting to indicate a more bullish outlook. The urge to find the next big trade has never been greater with so many alternative UK blue chips now trading close to highs.

Anglo American wants to hold back on dividend payments in order to stay fully invested in its sector, while the competition is cutting back on investment to please shareholders. Both approaches have their pros and cons, but which would convince you, the trader?

Glencore (GLEN)

GLEN - 2 year, daily

Glencore PLC (LSE) (-)

Source: IT Finance, Alpha Terminal 15 July 2015

Glencore is of special interest, being that it is trading at all-time lows. You read correctly – Glencore has never traded lower than 227p since it listed in May 2011 following the merger of Glencore International and Xstrata. With shares having made a recent bounce off the floor of a shallow falling channel, could downside momentum be waning in anticipation of a reversal?

It’s impossible to speculate on further downside potential since we’re only a little way off uncharted waters – and how much further the miners could possibly fall is anyone’s guess, but a conservative estimate to the upside puts 280p as a crucial level which, if surpassed, could provide support for a continued recovery to 320p and above.

If that happens it would mean 28% upside potential for the stock. If a return to 2011 highs were to materialise we’d be looking at 118%. That’s a long shot, but all it may take is some astute management at Glencore and a return of some form of normality to the Chinese markets. Think that’ll happen?!

Best, worst and average broker targets on GLEN

GLEN consensus

Source: IT Finance, 9 July 2015

Shares are currently down around the most bearish broker target (Liberum, 199p), and having made a bounce off all-time lows 227.8pbulls will be hoping for a re-visit of the channel ceiling and Goldman Sachs’ target price 336p while bears will be looking for signs of a dead cat bounce and new all-time lows in the coming months.

Latest GLEN broker targets

GLEN lightmap

Source: Bloomberg, 9 July 2015

BHP Billiton (BLT)

The Anglo-Australian multinational has the benefit of having its fingers in the pies of the miningmetals and petroleum sectors and is a big player in all three.

Having at one point in its tumultuous history traded near £15 per share, it’s unlikely we’ll be seeing a 1100recovery from this multi-faceted player! But a far more conservative estimate still indicates good profit potential.

BLT - 1 year, daily

BHP Billiton PLC (LSE) (-)

Source: IT Finance, Alpha terminal 15 July 2015

The share price has bounced up off levels not seen since 2009 following news that it will resume full production at its South Australian Olympic Dam mine in July 2015, 2 months ahead of schedule.

Might we see an apparently recovering copper price help BLT here? With the price of Crude Oil benchmarks US Light and Brent remaining volatile, yet holding above $50, BLT’s recovery potential arguably mimics that of AAL in the short term.

break-out above 1300p and the 50-day moving average could indicate a possible return to test resistance at falling highs from October 2014 - this alone implying 27% upside for the share price at time of writing.

Best, worst and average broker targets on BLT

BHP Consensus (LSE) (-)

Source: IT Finance, 9 July 2015

Downside potential is a concern here (for bulls, anyway), although noting BLT’s diversity – it’s in oil & gas, mining and metals – having seen it through arguably harsher times than this, we think its potential to outperform outweighs the (still real, however) risk of a pullback.

Latest BLT broker targets

BLT lightmap

Source: Bloomberg, 9 July 2015

The positioning of the best, worst and average broker targets confirms an improving outlook for the sector as a whole. Bullish Bernstein thinks there is upside far outweighing that mentioned above (which could return a healthy profit nonetheless) while BNP Paribas issued its bearish recommendation a full month ago.

Rio Tinto (RIO)

RIO - 2.5 year, daily

Rio Tinto PLC (-)

Source: IT Finance, Alpha Terminal 15 July 2015

One of the more resilient UK Index miners and a favourite among traders, Rio Tinto shares are also currently trading around levels not seen since 2009. Having made the most impressive bounce of all the miners to date after testing support at the 2450p level, are we due a recovery  back towards August 2014 highs?

Unrealistic? OK, what about a mere 350p rebound to potential resistance around 2800p? 14%? Not bad!

Best, worst and average broker targets on RIO

Rio Consensus (-)

Source: IT Finance, 9 July 2015

Rio Tinto, like rival BHP Billiton has been engaging in significant capex cuts and streamlining so that it can maintain its dividend payments – something always pleasing to value investors.  Indeed, it’s always good to see a dividend being paid out since it’s a sign of financial health, but don’t get too hung up on dividends for reasons mentioned above.

We’re looking at these stocks for their potential to register big share price moves. Where do you think the miners should be directing their capital to ensure those moves happen?

Latest RIO broker targets

RIO lightmap

Source: Bloomberg, 9 July 2015

Rio is potentially the most exciting mining stock in the UK 100 . Currently trading right in the red end of its target price light map, it appears the bears have called it correctly.

There’s just one niggling issue - they called it correctly months ago. Recent updates from the brokers are more bullish than they’ve been at any point so far this year – on the mining sector as a whole - and the potential upside from current lows could be considerable for investors with the foresight and the nerve to hold on for the ride.

Page: 01

This research is produced by Accendo Markets Limited. Research produced and disseminated by Accendo Markets is classified as non-independent research, and is therefore a marketing communication. This investment research has not been prepared in accordance with legal requirements designed to promote its independence and it is not subject to the prohibition on dealing ahead of the dissemination of investment research. This research does not constitute a personal recommendation or offer to enter into a transaction or an investment, and is produced and distributed for information purposes only.

Accendo Markets considers opinions and information contained within the research to be valid when published, and gives no warranty as to the investments referred to in this material. The income from the investments referred to may go down as well as up, and investors may realise losses on investments. The past performance of a particular investment is not necessarily a guide to its future performance. Prepared by Michael van Dulken, Head of Research

Spread bets and CFDs are complex instruments and come with a high risk of losing money rapidly due to leverage.
Spread bets and CFDs are complex instruments and come with a high risk of losing money rapidly due to leverage. 67% of retail investor accounts lose money when spread betting and/or trading CFDs with this provider. You should consider whether you understand how spread bets and CFDs work and whether you can afford to take the high risk of losing your money.
.