X

Get our occasional Market Report emails

sent straight to your inbox

There’s no charge for this.

Getting latest data loading
Home / Special Reports / UK Index Diversification: The key to 2016 profits

This report is not a personal recommendation and does not take into account your personal circumstances or appetite for risk.

11 January 2016

UK Index Diversification: The key to 2016 profits

Not all doom ‘n’ gloom

They say a picture paints a thousand words and there is indeed nothing better than a price chart to show the many attractive opportunities 2015 presented in terms of share price moves. Have a look at a UK Index chart. It wasn’t all. A terrific journey was to be had along the way if you looked a little further and considered other options.

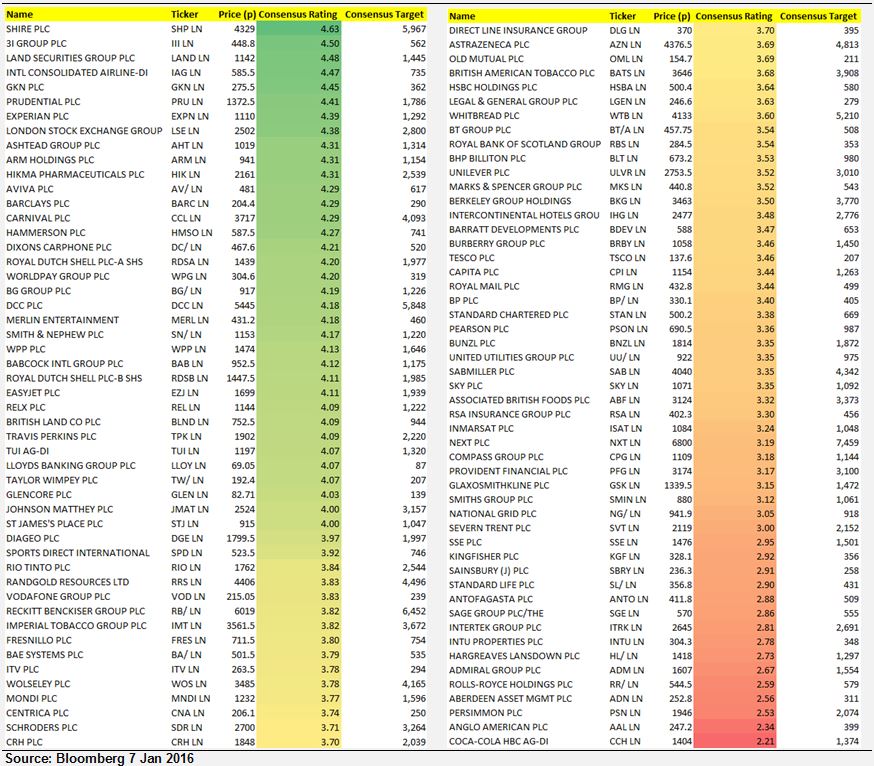
While the UK Index did indeed fall by 5%, don’t forget it is an index of 100 stocks. And one thing is for sure, they didn’t all fall 5% last year. For sure, some fell a lot more, widely talked about in myriad annual media roundups over the festive period. But what about the stocks that fared rather better, in some cases posting impressive gains of up to 45%? Who’s taking about them?

Did you know?

Certain housebuilders rose 30 to 40% thanks to government stimulus programmes and the prospect of low UK interest rates for longer. What about insurers whose share prices rallied 20 to 30% thanks to solid growth and continually generous dividend policies? Travel stocks climbed 25-30% on low oil prices.

Nearly all media focus has been on falling commodity prices and the knock-on for the Oil and Mining sector. Because this is what weighs most heavily in the UK Index , or used to be at least. But there’s lots going on elsewhere.

The usual suspects

Digging deeper into the statistics we note that since the beginning of 2015, and including the first few days of the new year, UK Index declines of 650pts can be 90% attributed to just 25% of its components. And it is no surprise to see this small group dominated two thirds (16 stocks) by Oil, Financials and Mining stocks. And the remainder can, in the main, be attributed to multiple and persistent profits warnings and well-documented troubles.

Our point is that casting the net wider and considering other less well-known names can be highly beneficial to both the short-term trader and longer-term investor. And diversifying can also include trading shares short - if something is trending south, maybe there are profits to be made from further falls.

Page: 01

2015 Winners

UK Index  winners

2015 Losers

UK Index  losers

Page: 02

Before you rush...

The above tables show the performance of the UK Index ’s components since 31 Dec 2014. That’s not to say you should rush in and buy all 10 of what did best last year hoping for further solid gains. Or that you should consider the bottom 10 as either recovery or short candidates. The point we make is that the UK Index did fall 5% last year. However, it was by virtue of it being an index of 100 stocks, and thus highly diversified, that it fell by only 5%.

Any manager of a Mining/Oil fund is sure to have taken a bath last year with losses likely >30%. But for reasons not entirely unknown before the start of 2015. China has been growing more slowly and thus demanding less raw materials for a good while now. Therefore anyone who has held on to loss-making positions in anything commodity-related has been stubborn to the point of self-harm as China data disappointed on a monthly basis and the commodity currency USD strengthened in the moved towards December’s first Fed rate hike in 9 years.

Happy New Year Statto!

Our full UK Index breakdown (please ask for the spreadsheet) suggests you had a 25% chance of picking a stock that gained 10-45% (ignore DCC +56% as it only entered the index late Dec along with PFG and WPG). 15% of shares rose 20%+. If the UK Index -5% is your problem, you still had a 65% chance of picking a stock that outperformed the index last year. Equally you had a 75% chance of not picking one of the few stocks that fell 10-80%. No surprise to see 8 of the bottom 10 are Miners, Oil or Financials. These are good stats. So long as you respect the need for diversification and to look outside the usual suspects of Banks, Miners and Oil.

 What held the index back?

UK Index  draggers

The prior table shows what has held the index back most since end-2014. As we said earlier, no surprise to see Oil, Miners and Banks making up the bulk of lost points given their exposure to a falling oil price, falling commodity prices and global growth sentiment in general. Of the 650pt UK Index index decline, the bottom 5 (Royal Dutch Shell, HSBC, BP, Rio and RBS) account for a whopping 50%!

Our point here is that the UK Index ’s losses and hindrance has been very concentrated and thus should have been easy to avoid. So long as, and I repeat myself, you respect the need for diversification. Having a position in all the miners or all the banks does not count as being diversified. We’re talking about getting out of your comfort zone and considering some of the stocks that are deemed less sexy and less talked about because they are likely just grinding higher and off people’s radars. They might not deliver the daily moves many crave for in their quest to double their account in a week, but they are also stocks where you are far likely to get less hurt.

We’ve written before about shunning names unfamiliar to you and missing out on profitable opportunities. Restricting yourself to a select few stocks in only a couple of sectors can of course be highly profitable, but you also run the risk of being more exposed to market news when things go bad. You also risk becoming emotionally attached to the stocks, feeling the need to trade the names repeatedly to replicate gains or indeed recoup losses.

The UK Index offers a wealth of stocks which obviously offer profitable opportunities outside the usual suspects, being just as big/liquid and easy to trade. And we are here to talk about all 100 not just the select few that are mentioned daily in the media because they are helping it rally or fall.

“It’s as much about capital appreciation as it is about capital accumulation.”

Page: 03

What the brokers are saying

Given the importance of institutional broker opinion and what analysts are saying, we thought it wise to include a comprehensive list of UK 100 stocks and what the consensus feeling is. This might help you with your analysis of what to do and how to construct/amend your portfolio.

This isn’t what we at Accendo think you should buy, sell (or even sell short) as we don’t offer advice. Rather this is a chance to see what the major city institutions are saying and for you to make your own informed decision.

When looking at the table, the final colored column represents a heat-map of how the brokers view the stock with dark green being a strong buy and dark red being a strong sell. The numbers also refer to the strength of the call as is stated below.

4-5 = Strong Buy         3-4 = Buy         3 = Hold        2-3 = Sell        1-2 = Strong Sell

 Please ask us for specific a breakdown of broker on any individual equities if you would like to know more. This is the type of information we offer to clients on a daily basis.

Capture

Page: 04

This research is produced by Accendo Markets Limited. Research produced and disseminated by Accendo Markets is classified as non-independent research, and is therefore a marketing communication. This investment research has not been prepared in accordance with legal requirements designed to promote its independence and it is not subject to the prohibition on dealing ahead of the dissemination of investment research. This research does not constitute a personal recommendation or offer to enter into a transaction or an investment, and is produced and distributed for information purposes only.

Accendo Markets considers opinions and information contained within the research to be valid when published, and gives no warranty as to the investments referred to in this material. The income from the investments referred to may go down as well as up, and investors may realise losses on investments. The past performance of a particular investment is not necessarily a guide to its future performance. Prepared by Michael van Dulken, Head of Research

Spread bets and CFDs are complex instruments and come with a high risk of losing money rapidly due to leverage.
Spread bets and CFDs are complex instruments and come with a high risk of losing money rapidly due to leverage. 67% of retail investor accounts lose money when spread betting and/or trading CFDs with this provider. You should consider whether you understand how spread bets and CFDs work and whether you can afford to take the high risk of losing your money.
.