X

Get our occasional Market Report emails

sent straight to your inbox

There’s no charge for this.

Getting latest data loading
Home / Special Reports / Day Trading: Increase your wealth quickly

This report is not a personal recommendation and does not take into account your personal circumstances or appetite for risk.

23 July 2015

Day Trading: Increase your wealth quickly

Day Trading

When you read that a share price finished up 2%, it might not sound that exciting. However, if you were to know that over the course of the day the shares traded -5%, before rallying significantly to be +5% and then falling again before closing +2%, a very different picture is painted – that of a 10% high to low trading range. It is this type of share price activity that day traders look to capitalise on, and they are rarely left twiddling their thumbs as many stocks display these characteristics on a daily basis.Day traders look to ride the intra-day up moves and down moves in succession, taking profits and even going back in at each turning point. So it’s just trading intra-day (in fact, intra-day trading is a more suitable name for it). It’s not some new and complicated concept – just trading on a shorter time scale than you may be used to. With many shares trading in ranges of 5% - 10% on a daily basis, day trading provides you with the opportunity to make in one day what other investors might make in a year or more.

Why should you day trade with Accendo Markets?

Accendo Markets gives you the ideal environment in which to day trade. If you want to go it alone, that’s fine. We provide the best online trading platform in the business as well as exclusive daily and weekly research publications - exactly what you need to trade the way you want to.

If you want some information, just put in a call to your dedicated trader. Want to be called at 7.45am sharp every morning and get the lowdown on your positions or favourite, securities before the market opens? That’s part of the service if you want it – and all at no extra cost. Want to deal over the telephone rather than online? Guess what… your dedicated trader can take care of that too. At no extra cost.

Accendo Markets provides exclusive research material to its clients including pre-market morning reports, key trading levels for European and US indices, trade ideas and live macro-economic data – all on a daily and intra-day basis, and that’s not to mention your trader who will ensure you are the first to know when anything happens in the markets that might affect your holdings. What’s more, we won’t ever tell you what to do.

We provide you with the facts. How you act on those is completely up to you. Given the amount of information we are bombarded with all day, every day, there really is no better place to day trade. With Accendo, you’ve got every angle covered.

But enough about how we can help you profit from day trading. Read on to find out how the professionals trade intra-day and you’ll soon realise that it’s not as complicated or daunting as it may seem.

Day Trading Toolbox: Technical Analysis

Technical analysis, otherwise known as ‘charting’, is widely used by professional and amateur day traders alike. It involves forecasting the movement of asset prices by studying past data, which typically includes price and volume plotted on the graph/chart. Technical analysis is essentially concerned with the anticipation of crowd behaviour (herd mentality) and market sentiment. This contrasts with fundamental analysis, which is concerned with an asset’s ‘fair value’.

Importantly, the basic principle of technical analysis is that an asset’s price reflects all relevant available information. An asset’s trading pattern, rather than external drivers such as economic, fundamental and news events, should tell the day trader all they need to know. Price action tends to repeat, because crowds tend toward predictable, patterned behaviour – hence the technical analyst’s focus on conditions and trends. What’s more, current technology has made technical analysis accessible and digestible to even the very least technically minded traders.

It is this powerful toolbox that is an indispensable part of the day trader’s arsenal. Technical analysis gives you indications of what is happening behind the scenes, before that news breaks. Furthermore, it’s not as complicated as it sounds – all you need to do is learn to recognise potential signals by way of just a few simple ‘technical indicators’ (the underlying workings of which you do not need to be able to understand).

Page: 01

Support and Resistance

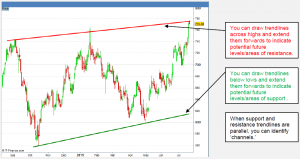
If the below chart applied to an equity, you would be in a position to identify levels of ‘Support’ and ‘Resistance’. So long as these levels remain unbroken, you could assume that shares will continue to trade within this range, or ‘channel.’

Click on the image to enlarge

Support

Source: IT Finance

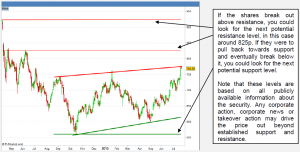
If one of these levels is broken, you would then be in a position to look to the next higher/lower level (usually a significant historic high or low) as the next level of potential resistance/support. The breakout level would likely reverse its prior role (support becomes resistance and vice versa) for any subsequent rally/declines.

Click on the image to enlarge

NextLevels

Source: IT Finance

Monitoring support and resistance in this stock can help you identify optimal entry and exit points. Of course, support and resistance levels reflect sentiment based on all publicly available information about the stock. Be aware – any new corporate action, corporate news (e.g. oil find, board changes) or takeover action may drive the price out beyond established support and resistance.

Page: 02

Volume – What’s going on behind the Scenes?

Click on the image to enlarge

Volume

Source: IT Finance

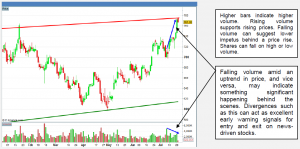
Looking at the vertical volume bars below the above price chart, you could identify when the volume of shares traded rises and falls. Given that it is assumed shares require volume (or market appetite) to rise, you can use increased volume to confirm that a rising price trend is valid. You could also use falling volume (as is the case above) to question a rising price trend such as the continued uptrend through July. Such a divergence, combined with the fact that shares have reached the trendline of resistance, could indicate an imminent correction or reversal.

Moving Averages

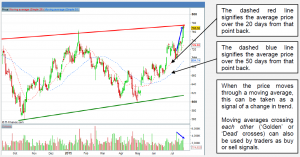
The dashed lines on the chart below are called the moving averages of the price. These take an average of the closing prices over a certain period. In our case we have used 20 days (red dashed line) and 50 days (blue dashed line), but there is no right or wrong choice here. Day traders will often use charts with time periods in the region of hours or even minutes, tailoring their choices to the specific security they are trading.

Click on the image to enlarge

MovAv

Source: IT Finance

Page: 03

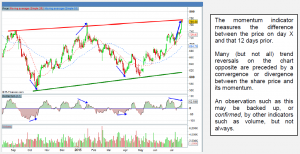
Momentum

A share price’s momentum is found by taking the difference between the price on day X and the price 12 days prior. It gives an indication of the amount by which the price has changed over 12 days and thus the underlying rate of change in the price. High momentum (positive or negative) illustrates high underlying power behind a price move (up or down). If a share’s price is trending up while its momentum is falling off (a negative divergence), that can be seen as an indication of an impending reversal. The same is true for a share price that is falling off while its momentum is trending upwards – a positive divergence or convergence.

Click on the image to enlarge

Mom

Source: IT Finance

And that’s it! Of course there are many more tools in the technical analyst’s box – but you should realise by now that if you just use the above simple indicators with discipline it is possible to predict the future with enough consistency to profit handsomely from day trading. It’s not rocket science, and it may even be more lucrative. However, it would be irresponsible to end things without a word or two on the importance of capital preservation. No one has ever called 100% of trades correctly, professionals included.

Capital Preservation

When placing a trade it’s natural to focus on the profits that could be made. It’s optimism. It’s human nature. However, it’s also prudent to consider what you could lose on the trade before deciding whether it is worthwhile. The best day traders (or any kind of trader, in fact) always consider the worst-case scenario for each trade, i.e. how far the price could move against them. While we tend to be quick to set automatic exit points (limits) to close a trade in a profit, it’s equally important for traders to consider doing so at the other end (stop losses) to limit the
possible damage from a bad trade, while if a profitable trade wants to become more profitable, why not let it? Trailing stop losses can be used to lock in rising profits.

Day trading is all about getting in and getting out within the day. Getting hurt by risking too much and taking too many costly losses along the way is best avoided. To find out how to assess your trade ideas, see our educational piece on Risk vs Reward.

Trading is as much about capital preservation as it is about capital accumulation - Trade Smart!

Page: 04

This research is produced by Accendo Markets Limited. Research produced and disseminated by Accendo Markets is classified as non-independent research, and is therefore a marketing communication. This investment research has not been prepared in accordance with legal requirements designed to promote its independence and it is not subject to the prohibition on dealing ahead of the dissemination of investment research. This research does not constitute a personal recommendation or offer to enter into a transaction or an investment, and is produced and distributed for information purposes only.

Accendo Markets considers opinions and information contained within the research to be valid when published, and gives no warranty as to the investments referred to in this material. The income from the investments referred to may go down as well as up, and investors may realise losses on investments. The past performance of a particular investment is not necessarily a guide to its future performance. Prepared by Michael van Dulken, Head of Research

Spread bets and CFDs are complex instruments and come with a high risk of losing money rapidly due to leverage.
Spread bets and CFDs are complex instruments and come with a high risk of losing money rapidly due to leverage. 67% of retail investor accounts lose money when spread betting and/or trading CFDs with this provider. You should consider whether you understand how spread bets and CFDs work and whether you can afford to take the high risk of losing your money.
.