Standard Chartered
Is this trend a good trading opportunity?
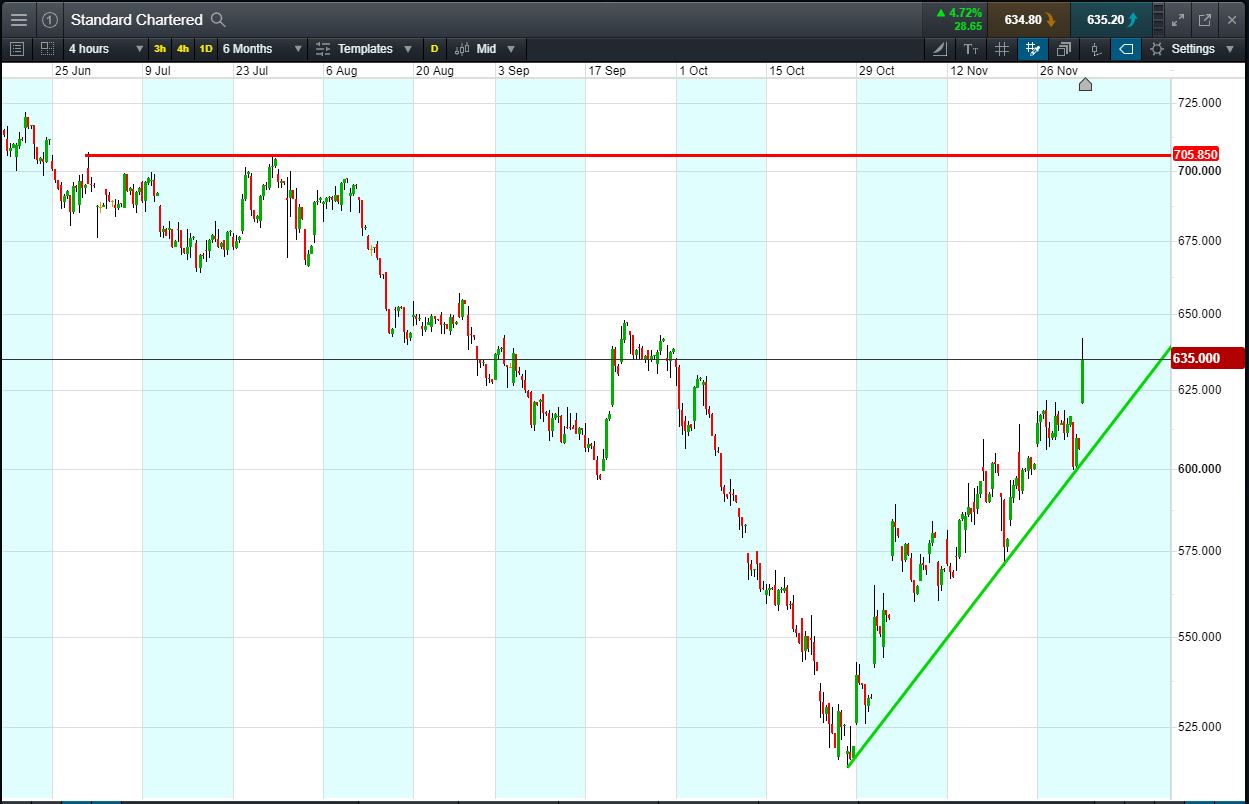
Will Standard Chartered turn, or will it continue to rise beyond 705p?
- The chart shows Standard Chartered price action since late June.
- Shares in a 5-week uptrend from October’s 514p lows; now at 635p.
- 29 Nov: Berenberg says StanChart was one of the top performers in the UK banking stress tests
- Shares -29.5% from 2018 highs; +18.5% from 2018 lows; -18.6% year-to-date
- In the last 5 weeks, the shares have risen over 21%. Will this momentum continue?
- Source: Bloomberg, FT, Reuters, DJ Newswires, AlphaTerminal
Click to enlarge
Trading Standard Chartered – An Example
Let’s say the trend appeals to you, you think it’s likely to continue. You decide to buy exposure to £10,000 worth of Standard Chartered using a CFD, at the current price of 635p. To do this, you need £2,000.
Let’s assume Standard Chartered trend continues to July high of 705p (+11%). Your profit would be £1100, from your initial investment of £2,000.
Conversely, let’s assume you open the above position, and place a stop-loss at 6% from the current price. Standard Chartered falls 6% and hits your stop-loss. Your loss would be £600.
This is provided for information purposes only. It should not be taken as a recommendation.