Getting latest data loading
X

Request a Call to Trade

In addition to the daily Research emails, I would also like to receive the Accendo Markets Weekly Newsletter and occasional Market Report emails highlighting various trading opportunities.
When you enter your telephone number, we may call or message you occasionally with trading opportunities. You can opt out at any time
Home / Breakouts / Berkeley Group

This report is not a personal recommendation and does not take into account your personal circumstances or appetite for risk.

Berkeley Group

Is this breakout a good trade for you?

Will Berkeley Group turn, or will it continue to fall beyond 3,279p?

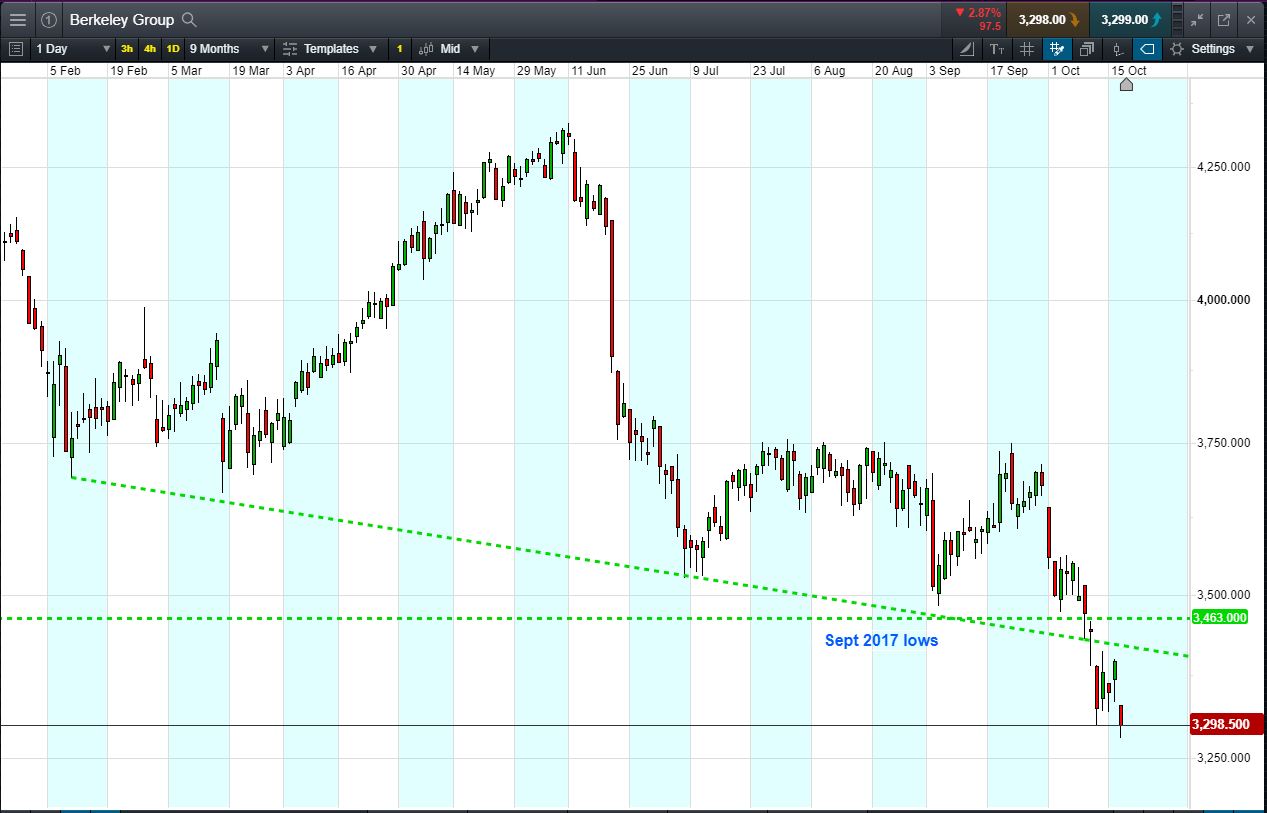
  • The chart shows the last 9 months’ price action for Berkeley Group.
  • The shares have broken below twin support levels around 3,450p to trade 3,299p (at time of writing).
  • Broken below September 2017 lows at 3,463p.
  • Recent profits warning from peer house-builder Crest Nicholson is supporting the breakdown.
  • Weakness in the London and South-East UK housing market is helping shares maintain downward momentum.
  • The ‘trend is your friend’. Will it continue?
  • Will the shares fall back to 3,164p July 2017 lows?
  • Shares -21.6% from 2018 highs; +3% from 2018 lows; -21.3% year-to-date.
  • Source: Bloomberg, FT, Reuters, DJ Newswires

Click to enlarge

Trading Berkeley Group – An Example

Let’s say the breakdown appeals to you, you think it’s likely to continue. You decide to buy exposure to £10,000 worth of Berkeley Group using a CFD, at the current price of 3,299p. To do this, you need £2,000.

Let’s assume the Berkeley Group trend continues downwards to 3,164p (-4%). Your profit would be £400, from your initial investment of £2,000.

Conversely, let’s assume you open the above position, and place a stop-loss at 5% from the current price. Berkeley Group breaks higher, rising 5% and it hits your stop-loss. Your loss would be £500.

This is provided for information purposes only. It should not be taken as a recommendation.

This research is produced by Accendo Markets Limited. Research produced and disseminated by Accendo Markets is classified as non-independent research, and is therefore a marketing communication. This investment research has not been prepared in accordance with legal requirements designed to promote its independence and it is not subject to the prohibition on dealing ahead of the dissemination of investment research. This research does not constitute a personal recommendation or offer to enter into a transaction or an investment, and is produced and distributed for information purposes only.


Accendo Markets considers opinions and information contained within the research to be valid when published, and gives no warranty as to the investments referred to in this material. The income from the investments referred to may go down as well as up, and investors may realise losses on investments. The past performance of a particular investment is not necessarily a guide to its future performance.

Spread bets and CFDs are complex instruments and come with a high risk of losing money rapidly due to leverage.
Spread bets and CFDs are complex instruments and come with a high risk of losing money rapidly due to leverage. 67% of retail investor accounts lose money when spread betting and/or trading CFDs with this provider. You should consider whether you understand how spread bets and CFDs work and whether you can afford to take the high risk of losing your money.
.