Range Trading – Lloyds, RBS
Lloyds
This recent chart shows how Lloyds repeatedly bounced between 56.8p and 58.4p. This is a range of 1.65p, or 2.8%*.
- A trader might buy around 56.8p, and sell around 58.4p.
- The intention is to hold the shares as they rise, selling before they turn down again.
- Ranges often develop on shares like Lloyds.
- Keep an eye on Lloyds. If a range develops again, and you see an opportunity, be ready.
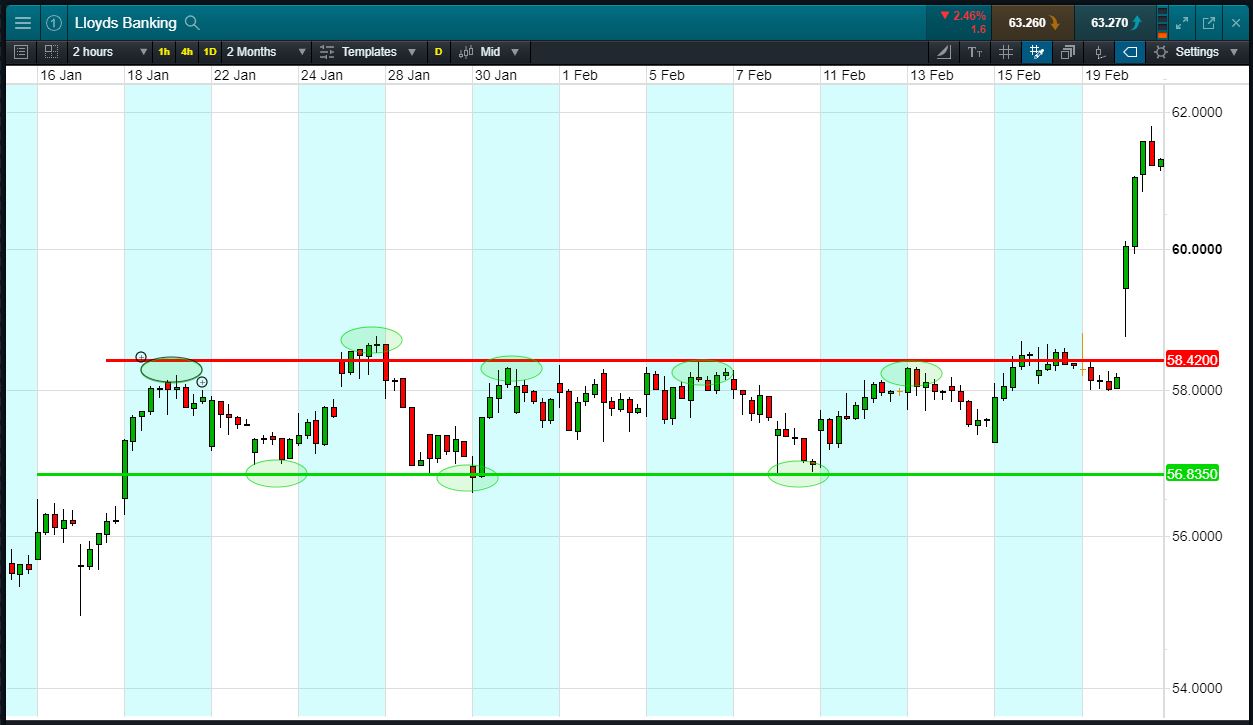
Assuming a £10,000 CFD position on Lloyds, requiring a 20% deposit, correctly calling each of those 2.8% moves could have generated profits of £280 per trade. If the shares went the other way, however, losses of £280 were possible
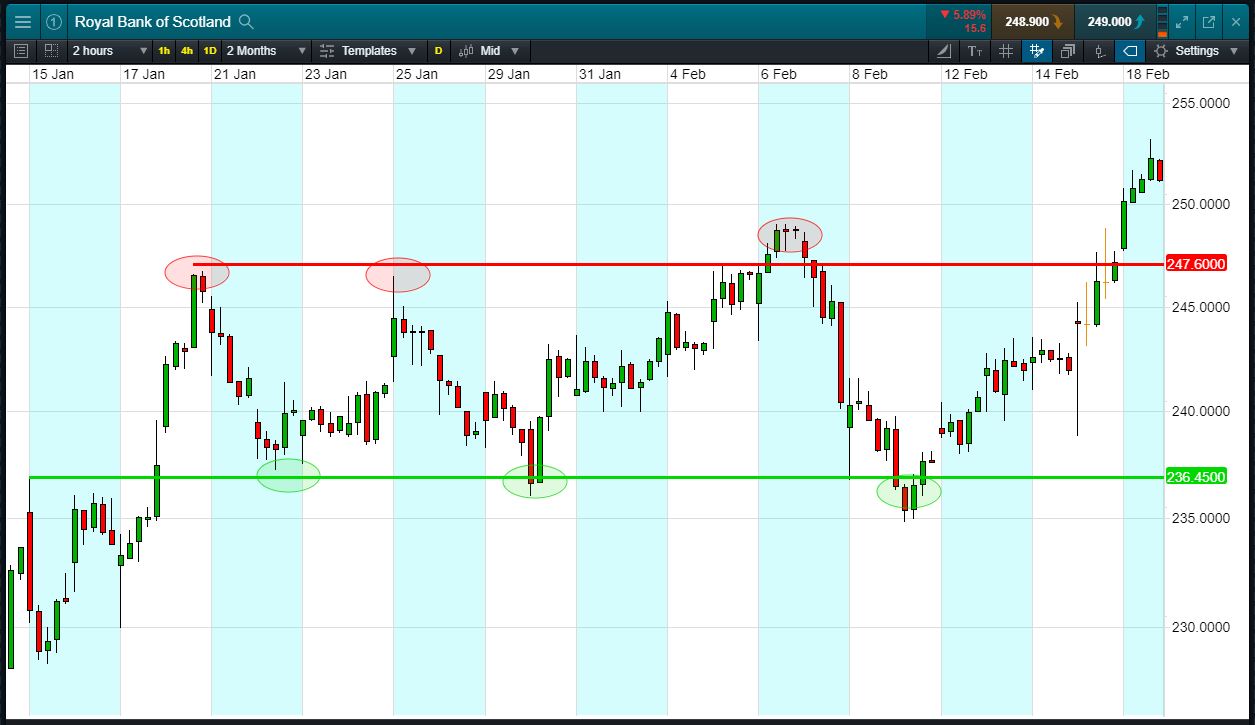
RBS
- A trader might buy around 236p, and sell around 247p.
- The intention is to hold the shares as they rise, selling when they turn down again.
- Ranges often develop on shares like RBS.
- Keep an eye on RBS. If a range like this develops again, and you see an opportunity, be ready.
Assuming a £10,000 CFD position on RBS, requiring a 20% deposit, correctly calling each of those 4.6% moves could have generated profits of £460 per trade. If the shares went the other way, however, losses of £460 were possible
A trading range is a sideways channel on a chart. The shares repeatedly bounce from a zone of support and fall from a zone of resistance. Traders often use ranges to make trading decisions. Those trading UK Index Banks like Barclays, Lloyds, RBS and HSBC look for channels/ranges, assuming that the trend will continue.
*Past performance is no guarantee of the future