Unilever
A trading opportunity for you?
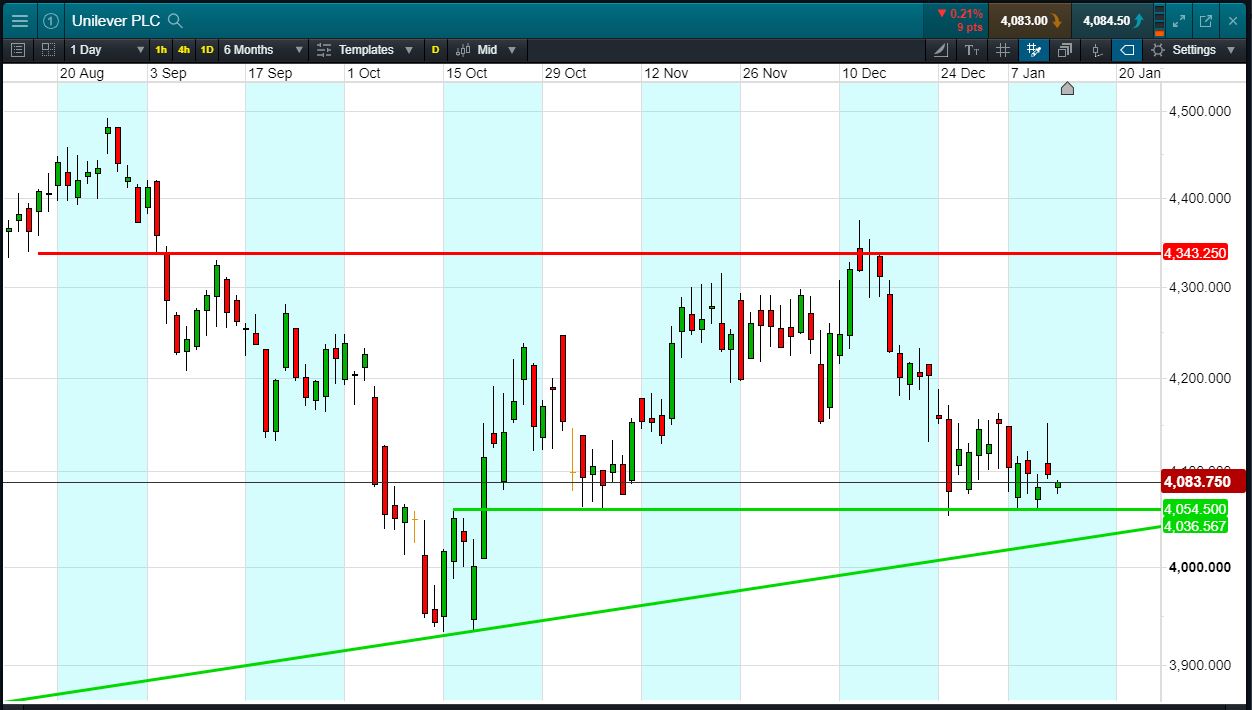
Will Unilever break support, or will it rise again back to 4343p November highs?
- Unilever has twin rising support; horizontal from early November, rising from March.
- Latest bounce off 4056p support level, now trading 4084p (at time of writing).
- Will the pattern repeat itself? Will the shares bounce off support again?
- Shares -9.0% from 2018 highs; +11.5% from 2018 lows; -0.7% year-to-date.
- 6 Dec: New Unilever CEO reassuring on 2020 targets says Berenberg
- 3 Dec: Unilever’s purchased GSK assets will be a good fit says Moody’s
- Source: Bloomberg, FT, Reuters, DJ Newswires, AlphaTerminal
Click to enlarge
Trading Unilever – An Example
Let’s say you like the Unilever chart and you think the price is heading back towards 4343p again. You decide to buy exposure to £10,000 worth of Unilever using a CFD, at the current price of 4084p. To do this, you need £2,000.
Let’s assume Unilever rises back to 4343p (+6.3%). Your profit would be £634, from your initial investment of £2,000.
Conversely, let’s assume you open the above position, and place a stop-loss at 3% from the current price. Unilever falls 3% and hits your stop-loss. Your loss would be £300.
This is provided for information purposes only. It should not be taken as a recommendation.